The Ten Views of a Digital Solution define what complete solution documentation looks like. Diagrams as Code defines how diagrams should be produced — as text definitions that render, version-control, and evolve alongside the thing they describe.
The two are complementary. Each view produces artifacts; several of the most important are diagrams. This post maps which diagram types I mostly use for each view and which tools I reach for — one view at a time, in the same order as the Ten Views post.
A note on preference: the choices here are a selection from my own tooling, not an exhaustive inventory of every diagram type I use — PlantUML as the primary tool, Mermaid where it fits better, BPMN.io for formal process notation, and DBML for database schemas. That does not make them objectively correct. C4 notation, for instance, offers arguably the most structurally consistent approach across all views except ArchiMate — and many teams find it the stronger choice precisely because the notation is uniform from context diagram down to sequence. If your team already works in C4, applying it across the views is entirely coherent. Use these examples as a starting point, not a prescription.
Not Everything Is a Diagram
Each view produces a range of artifacts. Many of them are not best represented by a diagram at all. The Requirements view is primarily user stories, acceptance criteria, and Gherkin scenarios. The Organizational view often resolves to a RACI matrix rather than a visual. The Domain view includes a glossary of the ubiquitous language for each bounded context. The Information view includes a data catalogue or data classification register alongside any diagrams. Structured text, matrices, and lookup tables carry meaning that diagrams cannot.
This post is scoped to the diagram artifacts only: which diagram types I reach for in each view and why. The non-diagram artifacts are equally important to the completeness of each view, but they are a topic for another post.
The Running Example
Every diagram in this post illustrates one facet of the same system: a small online bookshop. Customers browse a catalogue, place orders, and receive fulfilment updates; the shop manages inventory, processes payments, and ships physical books. It is a deliberately familiar domain — the goal is for the diagrams to be readable without explanation, so the focus stays on the notation and the view, not on decoding the problem.
Most diagrams narrow further to a single subdomain — order management — rather than covering the bookshop as a whole. This keeps each example focused and consistent across views. Throughout this post, SL abbreviates the Sales domain and OM abbreviates the Order Management bounded context.
Each diagram is also a deliberate simplification. None of them attempt to fully design the system — they leave out complexity, edge cases, and detail that a real engagement would require. The point is to illustrate how each diagram type works and what it communicates, not to produce a complete or production-ready model.
All diagrams should be rendered as SVG — not PNG — so the output remains sharp at any zoom level. On any non-trivial solution they will grow large enough that fullscreen viewing and zoom/pan controls are not optional; make sure your documentation platform or viewer supports them before committing to this format. On this page, right-click any diagram and open it in a new tab to view it at full resolution.
Current State View
The current state view is the as-is picture — what exists before the new solution intervenes. Unlike the other views, there is no prescribed diagram type here: the right diagram is entirely determined by which pain points need to be made visible. If the problem is unclear system boundaries, a context diagram. If it is tangled internal dependencies, a component diagram. If it is a broken process, a sequence or activity diagram. In the worst case, the current state requires all of them — one for each dimension of the problem that needs to be understood before the target state can be designed. Any of the diagram types covered in the views below can apply here, depending on which aspect of the current state needs to be visible.
Domain View
The domain view captures the domain decomposition — domains, subdomains, and bounded contexts, their responsibilities, and the relationships between them — alongside the key DDD artifacts: aggregates, entities, value objects, domain events, and the ubiquitous language of each bounded context. This is where a domain model or domain map lives.
Domain map (PlantUML — component diagram) — business domains and subdomains at the top level using package as a grouping construct, bounded contexts within them, and integration patterns between contexts — shared kernel, customer/supplier, anti-corruption layer; scales from a high-level domain decomposition down to a full context map without the name being wrong at either level
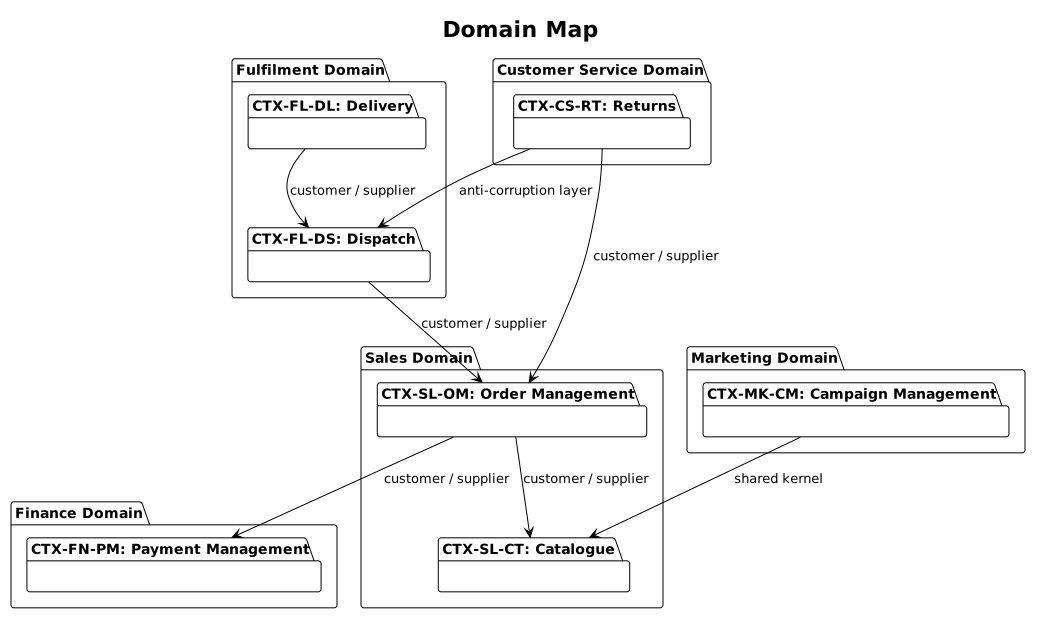
PlantUML source
@startuml domain-map
!theme plain
skinparam roundcorner 6

package "Sales Domain" {
  package "CTX-SL-CT: Catalogue" as ctxSlCt {
  }
  package "CTX-SL-OM: Order Management" as ctxSlOm {
  }
}

package "Marketing Domain" {
  package "CTX-MK-CM: Campaign Management" as ctxMkCm {
  }
}

package "Finance Domain" {
  package "CTX-FN-PM: Payment Management" as ctxFnPm {
  }
}

package "Fulfilment Domain" {
  package "CTX-FL-DS: Dispatch" as ctxFlDs {
  }
  package "CTX-FL-DL: Delivery" as ctxFlDl {
  }
}

package "Customer Service Domain" {
  package "CTX-CS-RT: Returns" as ctxCsRt {
  }
}

ctxSlOm --> ctxSlCt : customer / supplier
ctxSlOm --> ctxFnPm : customer / supplier
ctxMkCm --> ctxSlCt : shared kernel
ctxFlDs --> ctxSlOm : customer / supplier
ctxFlDl --> ctxFlDs : customer / supplier
ctxCsRt --> ctxSlOm : customer / supplier
ctxCsRt --> ctxFlDs : anti-corruption layer
@enduml
Domain model (PlantUML — class diagram) — key entities per bounded context across all domains, with solid arrows for intra-domain relationships and dashed arrows for cross-domain dependencies; at this conceptual level there are no attributes — the focus is on what the entities are and how they connect, not how they are implemented
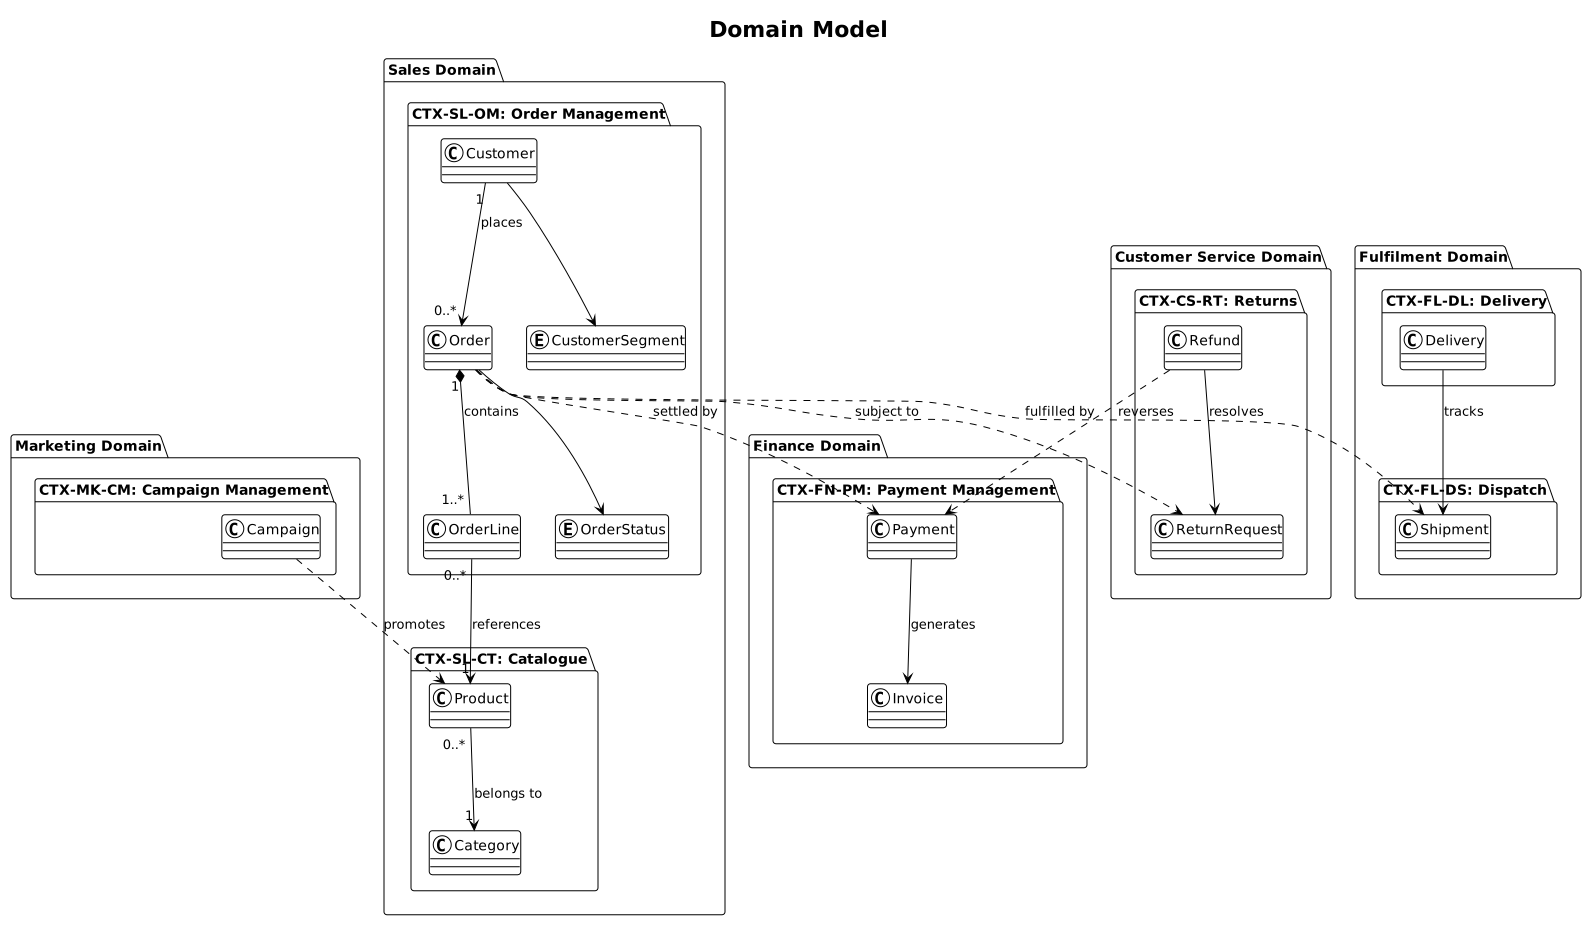
PlantUML source
@startuml domain-model
!theme plain
skinparam roundcorner 6

title Domain Model - All Domains

package "Sales Domain" {
  package "CTX-SL-CT: Catalogue" {
    class Product
    class Category
  }
  package "CTX-SL-OM: Order Management" {
    class Customer
    class Order
    class OrderLine
    enum CustomerSegment
    enum OrderStatus
  }
}

package "Marketing Domain" {
  package "CTX-MK-CM: Campaign Management" {
    class Campaign
  }
}

package "Finance Domain" {
  package "CTX-FN-PM: Payment Management" {
    class Payment
    class Invoice
  }
}

package "Fulfilment Domain" {
  package "CTX-FL-DS: Dispatch" {
    class Shipment
  }
  package "CTX-FL-DL: Delivery" {
    class Delivery
  }
}

package "Customer Service Domain" {
  package "CTX-CS-RT: Returns" {
    class ReturnRequest
    class Refund
  }
}

Customer "1" --> "0..*" Order : places
Order "1" *-- "1..*" OrderLine : contains
OrderLine "0..*" --> "1" Product : references
Product "0..*" --> "1" Category : belongs to
Customer --> CustomerSegment
Order --> OrderStatus
Payment --> Invoice : generates
Refund --> ReturnRequest : resolves
Delivery --> Shipment : tracks

Order ..> Shipment : fulfilled by
Order ..> Payment : settled by
Order ..> ReturnRequest : subject to
Campaign ..> Product : promotes
Refund ..> Payment : reverses
@enduml
Requirements View
The requirements view is primarily text — stakeholder stories, acceptance criteria, Gherkin scenarios. But the scope and stakeholder landscape benefit from visuals that surface who is involved, what they need, and how those needs decompose into deliverable work.
The diagrams in this section use a consistent type-first ID scheme. Every node carries a fully-qualified identifier that encodes its type, domain, bounded context, and sequence number — so any ID cited in a test case, an ADR, or a backlog ticket resolves unambiguously without a lookup:
| Prefix | Type | Example | Reads as |
|---|---|---|---|
CTX |
Bounded Context | CTX-SL-OM |
Order Management, Sales domain |
STK |
Stakeholder | STK-SL-OM-CX |
Customer stakeholder in OM |
STR |
Story | STR-SL-OM-CX-01 |
Story 01, Customer, OM |
FTR |
Feature | FTR-SL-OM-PL |
Order Placement feature in OM |
SCN |
Scenario | SCN-SL-OM-PL-01 |
Scenario 01, Order Placement, OM |
SL is the domain abbreviation (Sales) and OM is the bounded context abbreviation (Order Management). The domain is implicit in the bounded context but included in every ID so references remain self-contained when they travel outside the diagram.
A real solution will have multiple bounded contexts. Each of the maps below is scoped to a single bounded context — CTX-SL-OM here — and that is intentional. Combining several bounded contexts into one map makes it too large to read and too fragile to maintain. The recommendation is one map per bounded context, versioned alongside the code or requirements it describes.
Stakeholder map (PlantUML — mind map) — the bounded context as root, stakeholders as branches; a rapid overview of the stakeholder landscape without the detail of individual stories
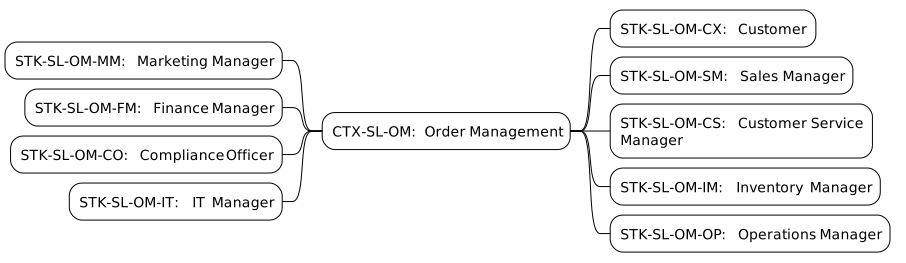
PlantUML source
@startmindmap
!theme plain
* CTX-SL-OM: Order Management
** STK-SL-OM-CX: Customer
** STK-SL-OM-SM: Sales Manager
** STK-SL-OM-CS: Customer Service Manager
** STK-SL-OM-IM: Inventory Manager
** STK-SL-OM-OP: Operations Manager
left side
** STK-SL-OM-MM: Marketing Manager
** STK-SL-OM-FM: Finance Manager
** STK-SL-OM-CO: Compliance Officer
** STK-SL-OM-IT: IT Manager
@endmindmap
Stakeholder stories map (PlantUML — mind map) — the bounded context as root, stakeholders as branches, their stories as sub-branches; a single map gives a complete view of who needs what and where stories cluster or overlap
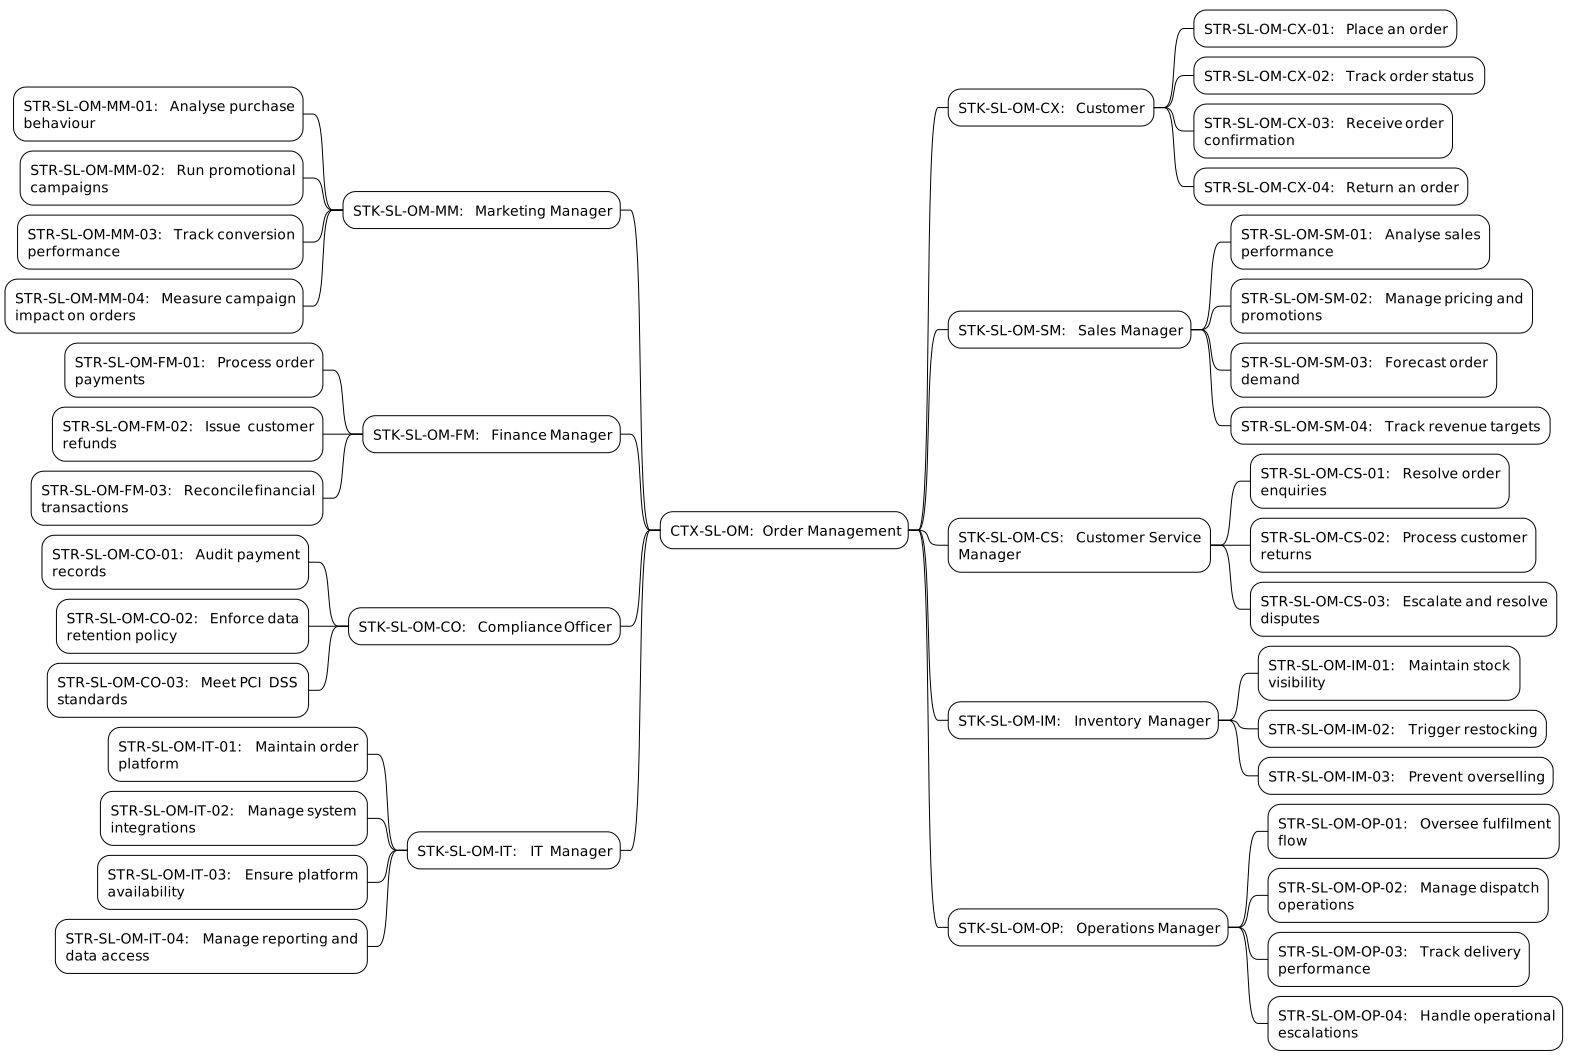
PlantUML source
@startmindmap
!theme plain
* CTX-SL-OM: Order Management
** STK-SL-OM-CX: Customer
*** STR-SL-OM-CX-01: Place an order
*** STR-SL-OM-CX-02: Track order status
*** STR-SL-OM-CX-03: Receive order confirmation
*** STR-SL-OM-CX-04: Return an order
** STK-SL-OM-SM: Sales Manager
*** STR-SL-OM-SM-01: Analyse sales performance
*** STR-SL-OM-SM-02: Manage pricing and promotions
*** STR-SL-OM-SM-03: Forecast order demand
*** STR-SL-OM-SM-04: Track revenue targets
** STK-SL-OM-CS: Customer Service Manager
*** STR-SL-OM-CS-01: Resolve order enquiries
*** STR-SL-OM-CS-02: Process customer returns
*** STR-SL-OM-CS-03: Escalate and resolve disputes
** STK-SL-OM-IM: Inventory Manager
*** STR-SL-OM-IM-01: Maintain stock visibility
*** STR-SL-OM-IM-02: Trigger restocking
*** STR-SL-OM-IM-03: Prevent overselling
** STK-SL-OM-OP: Operations Manager
*** STR-SL-OM-OP-01: Oversee fulfilment flow
*** STR-SL-OM-OP-02: Manage dispatch operations
*** STR-SL-OM-OP-03: Track delivery performance
*** STR-SL-OM-OP-04: Handle operational escalations
left side
** STK-SL-OM-MM: Marketing Manager
*** STR-SL-OM-MM-01: Analyse purchase behaviour
*** STR-SL-OM-MM-02: Run promotional campaigns
*** STR-SL-OM-MM-03: Track conversion performance
*** STR-SL-OM-MM-04: Measure campaign impact on orders
** STK-SL-OM-FM: Finance Manager
*** STR-SL-OM-FM-01: Process order payments
*** STR-SL-OM-FM-02: Issue customer refunds
*** STR-SL-OM-FM-03: Reconcile financial transactions
** STK-SL-OM-CO: Compliance Officer
*** STR-SL-OM-CO-01: Audit payment records
*** STR-SL-OM-CO-02: Enforce data retention policy
*** STR-SL-OM-CO-03: Meet PCI DSS standards
** STK-SL-OM-IT: IT Manager
*** STR-SL-OM-IT-01: Maintain order platform
*** STR-SL-OM-IT-02: Manage system integrations
*** STR-SL-OM-IT-03: Ensure platform availability
*** STR-SL-OM-IT-04: Manage reporting and data access
@endmindmap
Feature map (PlantUML — mind map) — the bounded context as root, features as branches organised by channel, leaf nodes as individual capabilities; shows what the solution delivers per channel without the detail of individual scenarios
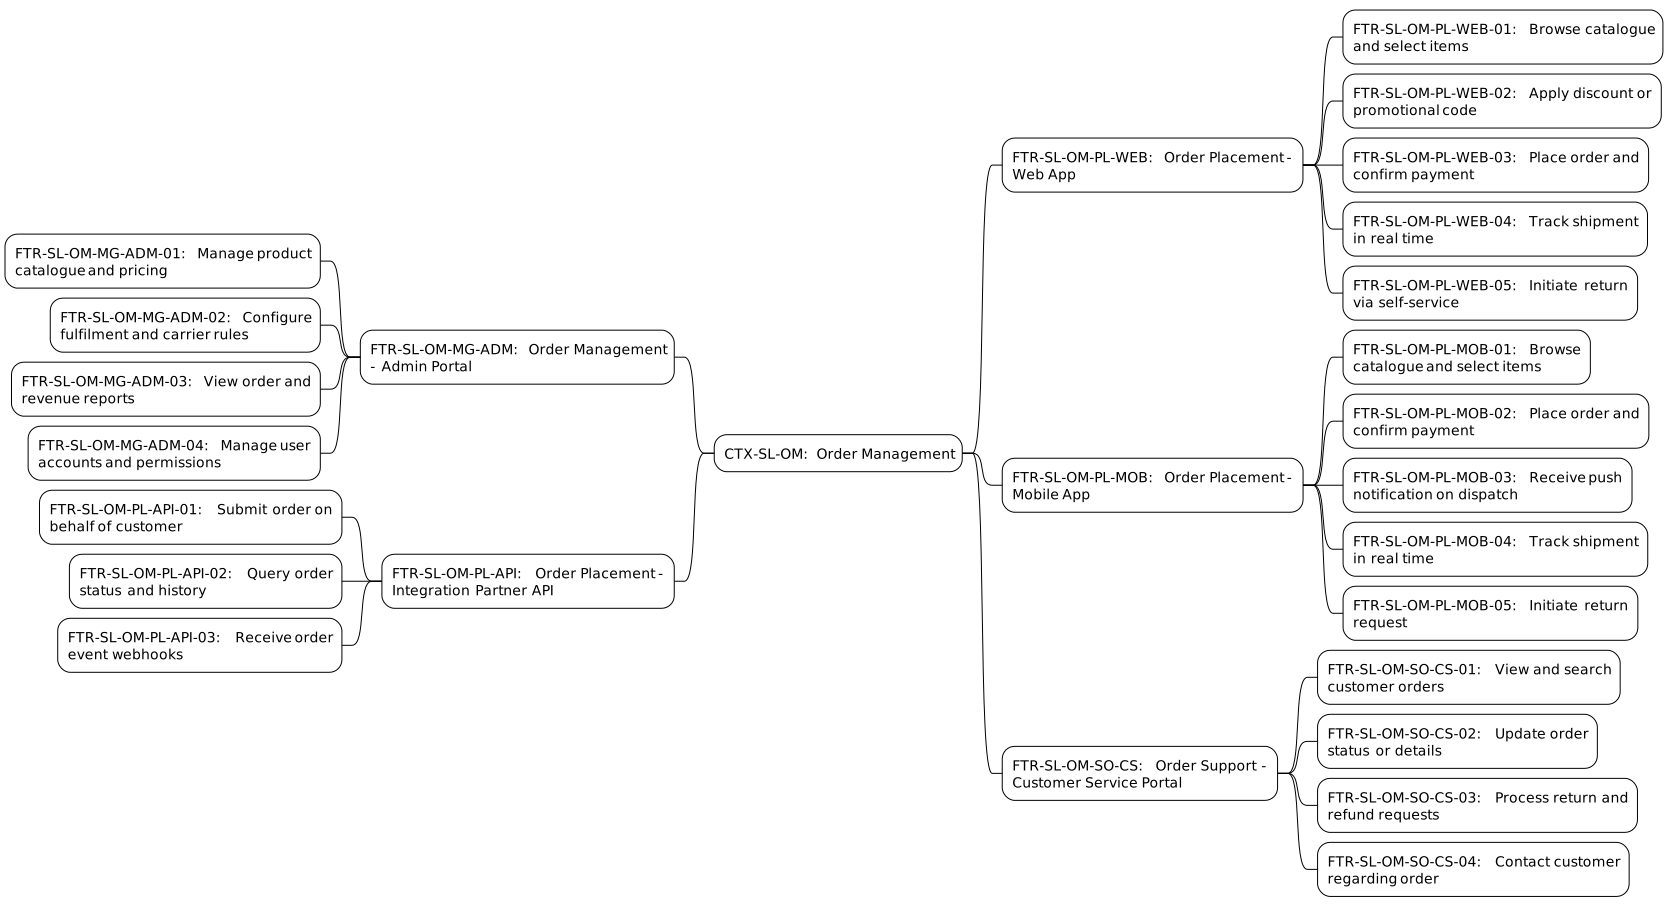
PlantUML source
@startmindmap
!theme plain
* CTX-SL-OM: Order Management
** FTR-SL-OM-PL-WEB: Order Placement - Web App
*** FTR-SL-OM-PL-WEB-01: Browse catalogue and select items
*** FTR-SL-OM-PL-WEB-02: Apply discount or promotional code
*** FTR-SL-OM-PL-WEB-03: Place order and confirm payment
*** FTR-SL-OM-PL-WEB-04: Track shipment in real time
*** FTR-SL-OM-PL-WEB-05: Initiate return via self-service
** FTR-SL-OM-PL-MOB: Order Placement - Mobile App
*** FTR-SL-OM-PL-MOB-01: Browse catalogue and select items
*** FTR-SL-OM-PL-MOB-02: Place order and confirm payment
*** FTR-SL-OM-PL-MOB-03: Receive push notification on dispatch
*** FTR-SL-OM-PL-MOB-04: Track shipment in real time
*** FTR-SL-OM-PL-MOB-05: Initiate return request
** FTR-SL-OM-SO-CS: Order Support - Customer Service Portal
*** FTR-SL-OM-SO-CS-01: View and search customer orders
*** FTR-SL-OM-SO-CS-02: Update order status or details
*** FTR-SL-OM-SO-CS-03: Process return and refund requests
*** FTR-SL-OM-SO-CS-04: Contact customer regarding order
left side
** FTR-SL-OM-MG-ADM: Order Management - Admin Portal
*** FTR-SL-OM-MG-ADM-01: Manage product catalogue and pricing
*** FTR-SL-OM-MG-ADM-02: Configure fulfilment and carrier rules
*** FTR-SL-OM-MG-ADM-03: View order and revenue reports
*** FTR-SL-OM-MG-ADM-04: Manage user accounts and permissions
** FTR-SL-OM-PL-API: Order Placement - Integration Partner API
*** FTR-SL-OM-PL-API-01: Submit order on behalf of customer
*** FTR-SL-OM-PL-API-02: Query order status and history
*** FTR-SL-OM-PL-API-03: Receive order event webhooks
@endmindmap
Scenario map (PlantUML — mind map) — drills into a single feature, preserving the breadcrumb path from context to feature group to feature; one scenario is the happy path, the rest are failure and exception cases — each one becomes its own sequence diagram
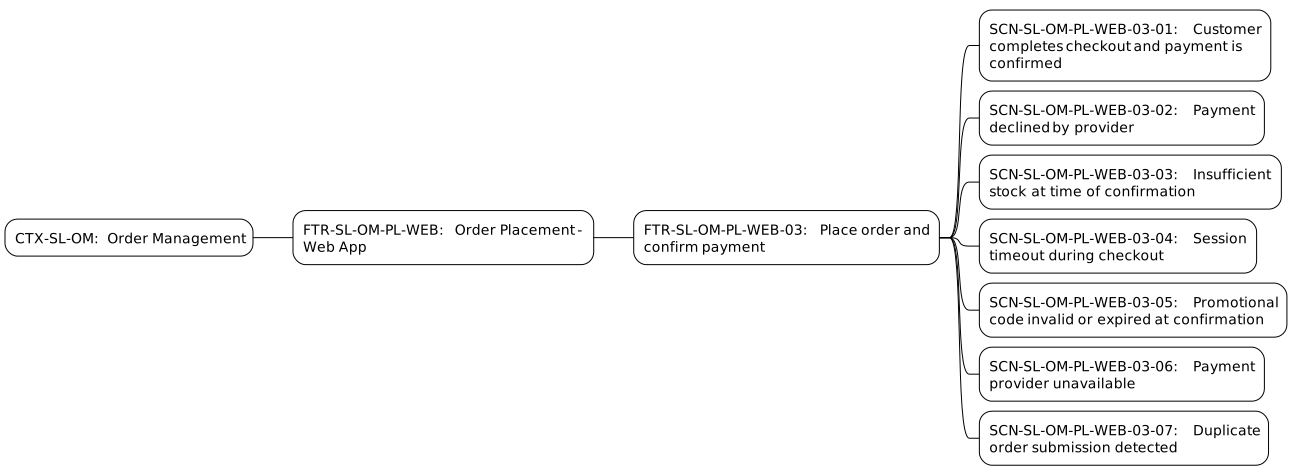
PlantUML source
@startmindmap
!theme plain
* CTX-SL-OM: Order Management
** FTR-SL-OM-PL-WEB: Order Placement - Web App
*** FTR-SL-OM-PL-WEB-03: Place order and confirm payment
**** SCN-SL-OM-PL-WEB-03-01: Customer completes checkout and payment is confirmed
**** SCN-SL-OM-PL-WEB-03-02: Payment declined by provider
**** SCN-SL-OM-PL-WEB-03-03: Insufficient stock at time of confirmation
**** SCN-SL-OM-PL-WEB-03-04: Session timeout during checkout
**** SCN-SL-OM-PL-WEB-03-05: Promotional code invalid or expired at confirmation
**** SCN-SL-OM-PL-WEB-03-06: Payment provider unavailable
**** SCN-SL-OM-PL-WEB-03-07: Duplicate order submission detected
@endmindmap
Feature priority quadrant (Mermaid — quadrantChart) — plots features on Business Value (x-axis) and Urgency (y-axis), both assessed by the accountable business stakeholder; the four quadrants make prioritization decisions explicit and reviewable
This diagram is a snapshot in time. Business value and urgency shift as the market changes, features get delivered, and new information surfaces. Revisit and re-plot regularly — a quadrant that looks the same after six months is not a sign of stability, it is a sign the diagram has been forgotten.
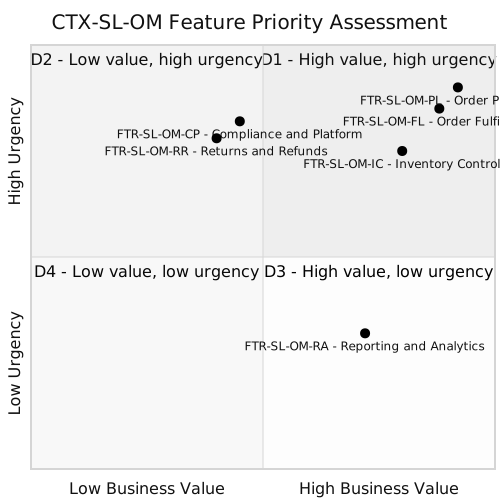
Note: labels use ID - Name rather than ID: Name because Mermaid’s quadrantChart syntax reserves the colon as the separator between a label and its coordinates — Label: [x, y]. A dash is the closest readable alternative.
Mermaid source
quadrantChart
    title CTX-SL-OM Feature Priority Assessment
    x-axis Low Business Value --> High Business Value
    y-axis Low Urgency --> High Urgency
    quadrant-1 D1 - High value, high urgency
    quadrant-2 D2 - Low value, high urgency
    quadrant-3 D4 - Low value, low urgency
    quadrant-4 D3 - High value, low urgency
    FTR-SL-OM-PL - Order Placement: [0.92, 0.90]
    FTR-SL-OM-FL - Order Fulfilment: [0.88, 0.85]
    FTR-SL-OM-IC - Inventory Control: [0.80, 0.75]
    FTR-SL-OM-RR - Returns and Refunds: [0.40, 0.78]
    FTR-SL-OM-CP - Compliance and Platform: [0.45, 0.82]
    FTR-SL-OM-RA - Reporting and Analytics: [0.72, 0.32]
Customer View
The customer view answers three questions: who are the customers, how do they reach the solution, and what do they experience when they use it. Segmentation maps establish which customer types the solution serves and how they differ in need and behaviour. A channel diagram shows which access points — web, mobile, API, portal — serve which segments. Journey diagrams map the sequence of steps a customer takes through a specific flow, including emotional state, touchpoints, and the moments where friction, handoffs, or failure occur. Together these three levels prevent a common failure mode: building something technically correct that misses who it is actually for.
Customer segment map (PlantUML — mind map) — the solution as root, customer segments as branches; a fast orientation to who the solution serves before going deeper into channel and journey detail
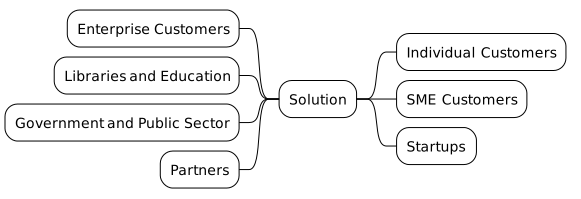
PlantUML source
@startmindmap
!theme plain
* Solution
** Individual Customers
** SME Customers
** Startups
left side
** Enterprise Customers
** Libraries and Education
** Government and Public Sector
** Partners
@endmindmap
Customer segment quadrant (Mermaid — quadrantChart) — plots segments on two business-relevant dimensions such as value vs. volume or engagement vs. complexity; useful when the goal is to communicate prioritisation of segments rather than their characteristics
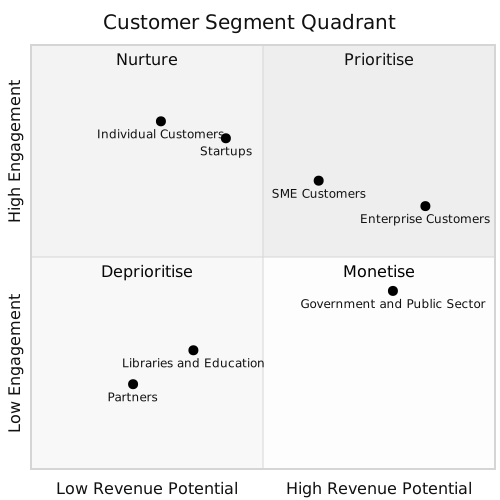
Mermaid source
quadrantChart
    title Customer Segment Quadrant
    x-axis Low Revenue Potential --> High Revenue Potential
    y-axis Low Engagement --> High Engagement
    quadrant-1 Prioritise
    quadrant-2 Nurture
    quadrant-3 Deprioritise
    quadrant-4 Monetise
    Enterprise Customers: [0.85, 0.62]
    Government and Public Sector: [0.78, 0.42]
    SME Customers: [0.62, 0.68]
    Startups: [0.42, 0.78]
    Individual Customers: [0.28, 0.82]
    Libraries and Education: [0.35, 0.28]
    Partners: [0.22, 0.20]
Customer channel diagram (PlantUML — component diagram) — shows the channels through which actors interact with the solution; in practice, one diagram per customer segment keeps the picture readable — channels relevant to Individual Customers differ meaningfully from those relevant to Enterprise or Partners, and combining all segments into one diagram produces clutter rather than clarity
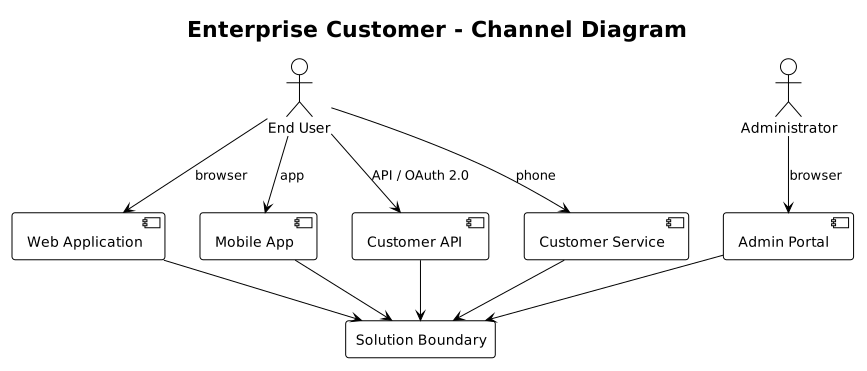
PlantUML source
@startuml channel-diagram
!theme plain
skinparam roundcorner 6

title Enterprise Customer - Channel Diagram

actor "End User" as endUser
actor "Administrator" as admin

component "Web Application" as web
component "Mobile App" as mobile
component "Admin Portal" as adminPortal
component "Customer API" as customerApi
component "Customer Service" as cs

rectangle "Solution Boundary" as solution

endUser --> web : browser
endUser --> mobile : app
endUser --> cs : phone
endUser --> customerApi : API / OAuth 2.0
admin --> adminPortal : browser

web --> solution
mobile --> solution
adminPortal --> solution
customerApi --> solution
cs --> solution
@enduml
Customer journey diagram (Mermaid — journey) — maps the experience of a specific actor phase by phase with satisfaction scores to surface friction points; scoped here to the Enterprise Customer End User — as with the channel diagram, one journey per segment and actor keeps the diagram focused and actionable

Mermaid source
journey
    title Enterprise Customer - End User Journey
    section Awareness - CTX-MK-CM
      Receive promotional campaign: 3: End User, Marketing
      Click through to bookshop: 4: End User
    section Discovery - CTX-SL-CT
      Search and browse catalogue: 4: End User, Catalogue
      Read book details and reviews: 4: End User, Catalogue
    section Selection - CTX-SL-CT
      Compare editions and prices: 3: End User, Catalogue
      Add to basket: 5: End User, Catalogue
      PL - Apply discount or promotion: 4: End User, Catalogue
    section Checkout - CTX-SL-OM
      PL - Review basket and totals: 4: End User, Orders
      PL - Enter delivery details: 2: End User, Orders
      PL - Select payment method: 3: End User, Orders
      PL - Confirm and place order: 5: End User, Orders
    section Payment - CTX-FN-PM
      PL - Payment authorised: 4: End User, Payments
      PL - Order confirmation received: 5: End User, Payments, Orders
    section Fulfilment - CTX-FL-DS
      FL - Order picked and packed: 4: End User, Fulfilment
      FL - Order dispatched to carrier: 4: End User, Fulfilment
      FL - Dispatch notification received: 4: End User, Fulfilment
    section Delivery - CTX-FL-DL
      FL - Track delivery status: 4: End User, Delivery
      FL - Receive delivery: 5: End User, Delivery
    section Returns - CTX-CS-RT
      RR - Raise return request: 2: End User, Support
      RR - Return collected by carrier: 3: End User, Support, Fulfilment
      RR - Refund received: 4: End User, Payments
Organizational View
The organizational view makes ownership and accountability explicit — who owns which systems, which teams sit behind which bounded contexts, and how the organisational structure maps to the solution structure. This matters because Conway’s Law is not theoretical: the system boundaries that survive long-term tend to reflect the team boundaries. An org chart shows the hierarchy and reporting lines; an actor-to-organisation map connects the internal actors referenced elsewhere in the solution documentation to the departments that own them.
Org chart (PlantUML — WBS) — team hierarchy, reporting lines, and groupings; most useful when the organisational picture needs to travel alongside the solution documentation rather than live only in an HR system

PlantUML source
@startwbs
!theme plain
* Digital Solution
** Sales Department
*** Catalogue Team
*** Order Management Team
*** Customer Service Team
**** Returns Team
** Marketing Department
*** Campaign Management Team
** Finance Department
*** Payment Management Team
** Fulfilment Department
*** Dispatch Team
*** Delivery Team
** IT Department
*** Application Team
*** Platform Team
*** Infrastructure Team
** Governance
*** Architecture Board
*** Security Team
*** Compliance
@endwbs
Actor to organisation map (PlantUML — component diagram) — maps internal actors to their department; establishes the organisational context for the actors referenced in the component view, making ownership and accountability explicit before drilling into systems

PlantUML source
@startuml actor-org-map
!theme plain
skinparam roundcorner 6

title Actor to Organisation Map

rectangle "Sales Department" {
  actor "Catalogue Manager" as catalogueMgr
  actor "Order Manager" as orderMgr
  actor "Customer Service Agent" as csAgent
}

rectangle "Marketing Department" {
  actor "Marketing Manager" as marketingMgr
}

rectangle "Finance Department" {
  actor "Accounts Manager" as accountsMgr
}

rectangle "Fulfilment Department" {
  actor "Warehouse Operative" as warehouseOp
  actor "Delivery Coordinator" as deliveryCoord
}

rectangle "IT Department" {
  actor "Software Engineer" as softwareEng
  actor "Platform Engineer" as platformEng
}

rectangle "Governance" {
  actor "Enterprise Architect" as architect
  actor "Compliance Officer" as compliance
}
@enduml
Information View
The information view captures what information exists, how it is classified, and who owns it. The focus is on information as an asset — not as a database schema (which belongs in the component view) and not as a domain entity (which belongs in the domain view). This view typically produces a data catalogue and a classification register alongside the diagram below; this post covers the diagram only.
Information model (PlantUML — class diagram) — information assets, their attributes, classification, ownership, and the relationships between them; sits above the implementation and above the domain, capturing what information the solution holds and is responsible for; one model per domain keeps it readable — the same information asset can be realised differently in different domains, and where that happens the domain map will show an anti-corruption layer between the contexts that own it
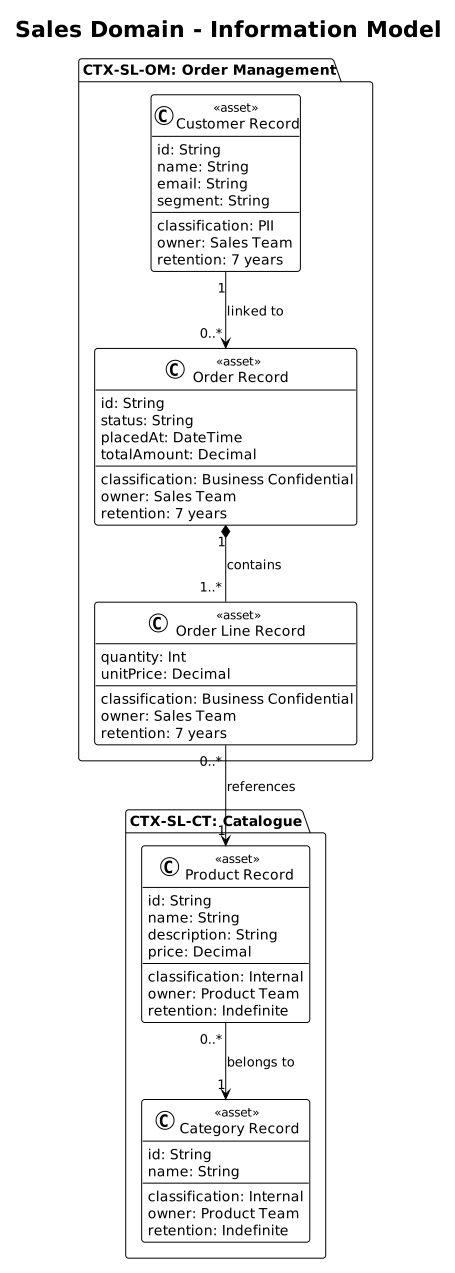
PlantUML source
@startuml information-model
!theme plain
skinparam roundcorner 6

title Sales Domain - Information Model

package "CTX-SL-OM: Order Management" {
  class "Customer Record" as customerRecord <<asset>> {
    id: String
    name: String
    email: String
    segment: String
    --
    classification: PII
    owner: Sales Team
    retention: 7 years
  }

  class "Order Record" as orderRecord <<asset>> {
    id: String
    status: String
    placedAt: DateTime
    totalAmount: Decimal
    --
    classification: Business Confidential
    owner: Sales Team
    retention: 7 years
  }

  class "Order Line Record" as orderLineRecord <<asset>> {
    quantity: Int
    unitPrice: Decimal
    --
    classification: Business Confidential
    owner: Sales Team
    retention: 7 years
  }

}

package "CTX-SL-CT: Catalogue" {
  class "Product Record" as productRecord <<asset>> {
    id: String
    name: String
    description: String
    price: Decimal
    --
    classification: Internal
    owner: Product Team
    retention: Indefinite
  }

  class "Category Record" as categoryRecord <<asset>> {
    id: String
    name: String
    --
    classification: Internal
    owner: Product Team
    retention: Indefinite
  }
}

customerRecord "1" --> "0..*" orderRecord : linked to
orderRecord "1" *-- "1..*" orderLineRecord : contains
orderLineRecord "0..*" --> "1" productRecord : references
productRecord "0..*" --> "1" categoryRecord : belongs to
@enduml
Process View
The process view captures how the solution behaves from a human perspective — activities, decisions, handoffs, exception paths, and who is responsible for each. Two tools serve different contexts here: BPMN for situations where formal process notation is required — regulatory compliance, certification, or handoff to a process engine — and PlantUML activity diagrams for everything else. The BPMN authoring experience is primarily visual, but it produces version-controllable XML; the activity diagram is written as code from the start, which means a process change produces a diff rather than a replaced image.
Process model (BPMN.io — BPMN) — where formal process notation is required for regulatory or certification purposes; the process flow produces version-controllable XML even though the authoring experience is primarily visual
BPMN source
<?xml version="1.0" encoding="UTF-8"?>
<bpmn:definitions xmlns:bpmn="http://www.omg.org/spec/BPMN/20100524/MODEL"
                  id="Definitions_1"
                  targetNamespace="http://bpmn.io/schema/bpmn">

  <bpmn:collaboration id="Collaboration_1">
    <bpmn:participant id="Participant_1" name="Order Fulfilment" processRef="Process_OrderFulfilment" />
  </bpmn:collaboration>

  <bpmn:process id="Process_OrderFulfilment" name="Order Fulfilment" isExecutable="false">

    <bpmn:laneSet id="LaneSet_1">
      <bpmn:lane id="Lane_Sales" name="Sales Department">
        <bpmn:flowNodeRef>Start_1</bpmn:flowNodeRef>
        <bpmn:flowNodeRef>Task_Validate</bpmn:flowNodeRef>
        <bpmn:flowNodeRef>Gateway_Valid</bpmn:flowNodeRef>
        <bpmn:flowNodeRef>Task_Reject</bpmn:flowNodeRef>
        <bpmn:flowNodeRef>End_Rejected</bpmn:flowNodeRef>
      </bpmn:lane>
      <bpmn:lane id="Lane_Finance" name="Finance Department">
        <bpmn:flowNodeRef>Task_Payment</bpmn:flowNodeRef>
      </bpmn:lane>
      <bpmn:lane id="Lane_Fulfilment" name="Fulfilment Department">
        <bpmn:flowNodeRef>Task_Dispatch</bpmn:flowNodeRef>
        <bpmn:flowNodeRef>Task_Deliver</bpmn:flowNodeRef>
        <bpmn:flowNodeRef>End_Fulfilled</bpmn:flowNodeRef>
      </bpmn:lane>
    </bpmn:laneSet>

    <bpmn:startEvent id="Start_1" name="Order received">
      <bpmn:outgoing>Flow_1</bpmn:outgoing>
    </bpmn:startEvent>
    <bpmn:serviceTask id="Task_Validate" name="Validate order">
      <bpmn:incoming>Flow_1</bpmn:incoming>
      <bpmn:outgoing>Flow_2</bpmn:outgoing>
    </bpmn:serviceTask>
    <bpmn:exclusiveGateway id="Gateway_Valid" name="Valid?">
      <bpmn:incoming>Flow_2</bpmn:incoming>
      <bpmn:outgoing>Flow_Yes</bpmn:outgoing>
      <bpmn:outgoing>Flow_No</bpmn:outgoing>
    </bpmn:exclusiveGateway>
    <bpmn:serviceTask id="Task_Reject" name="Reject order">
      <bpmn:incoming>Flow_No</bpmn:incoming>
      <bpmn:outgoing>Flow_5</bpmn:outgoing>
    </bpmn:serviceTask>
    <bpmn:endEvent id="End_Rejected" name="Order rejected">
      <bpmn:incoming>Flow_5</bpmn:incoming>
    </bpmn:endEvent>
    <bpmn:serviceTask id="Task_Payment" name="Process payment">
      <bpmn:incoming>Flow_Yes</bpmn:incoming>
      <bpmn:outgoing>Flow_3</bpmn:outgoing>
    </bpmn:serviceTask>
    <bpmn:serviceTask id="Task_Dispatch" name="Dispatch order">
      <bpmn:incoming>Flow_3</bpmn:incoming>
      <bpmn:outgoing>Flow_4</bpmn:outgoing>
    </bpmn:serviceTask>
    <bpmn:serviceTask id="Task_Deliver" name="Deliver order">
      <bpmn:incoming>Flow_4</bpmn:incoming>
      <bpmn:outgoing>Flow_6</bpmn:outgoing>
    </bpmn:serviceTask>
    <bpmn:endEvent id="End_Fulfilled" name="Order fulfilled">
      <bpmn:incoming>Flow_6</bpmn:incoming>
    </bpmn:endEvent>
    <bpmn:sequenceFlow id="Flow_1" sourceRef="Start_1" targetRef="Task_Validate" />
    <bpmn:sequenceFlow id="Flow_2" sourceRef="Task_Validate" targetRef="Gateway_Valid" />
    <bpmn:sequenceFlow id="Flow_Yes" name="Yes" sourceRef="Gateway_Valid" targetRef="Task_Payment" />
    <bpmn:sequenceFlow id="Flow_No" name="No" sourceRef="Gateway_Valid" targetRef="Task_Reject" />
    <bpmn:sequenceFlow id="Flow_3" sourceRef="Task_Payment" targetRef="Task_Dispatch" />
    <bpmn:sequenceFlow id="Flow_4" sourceRef="Task_Dispatch" targetRef="Task_Deliver" />
    <bpmn:sequenceFlow id="Flow_5" sourceRef="Task_Reject" targetRef="End_Rejected" />
    <bpmn:sequenceFlow id="Flow_6" sourceRef="Task_Deliver" targetRef="End_Fulfilled" />
  </bpmn:process>

</bpmn:definitions>
Activity flow (PlantUML — activity diagram) — activities, decisions, handoffs, and exception paths from a human perspective; the natural format for documenting how work moves through a process
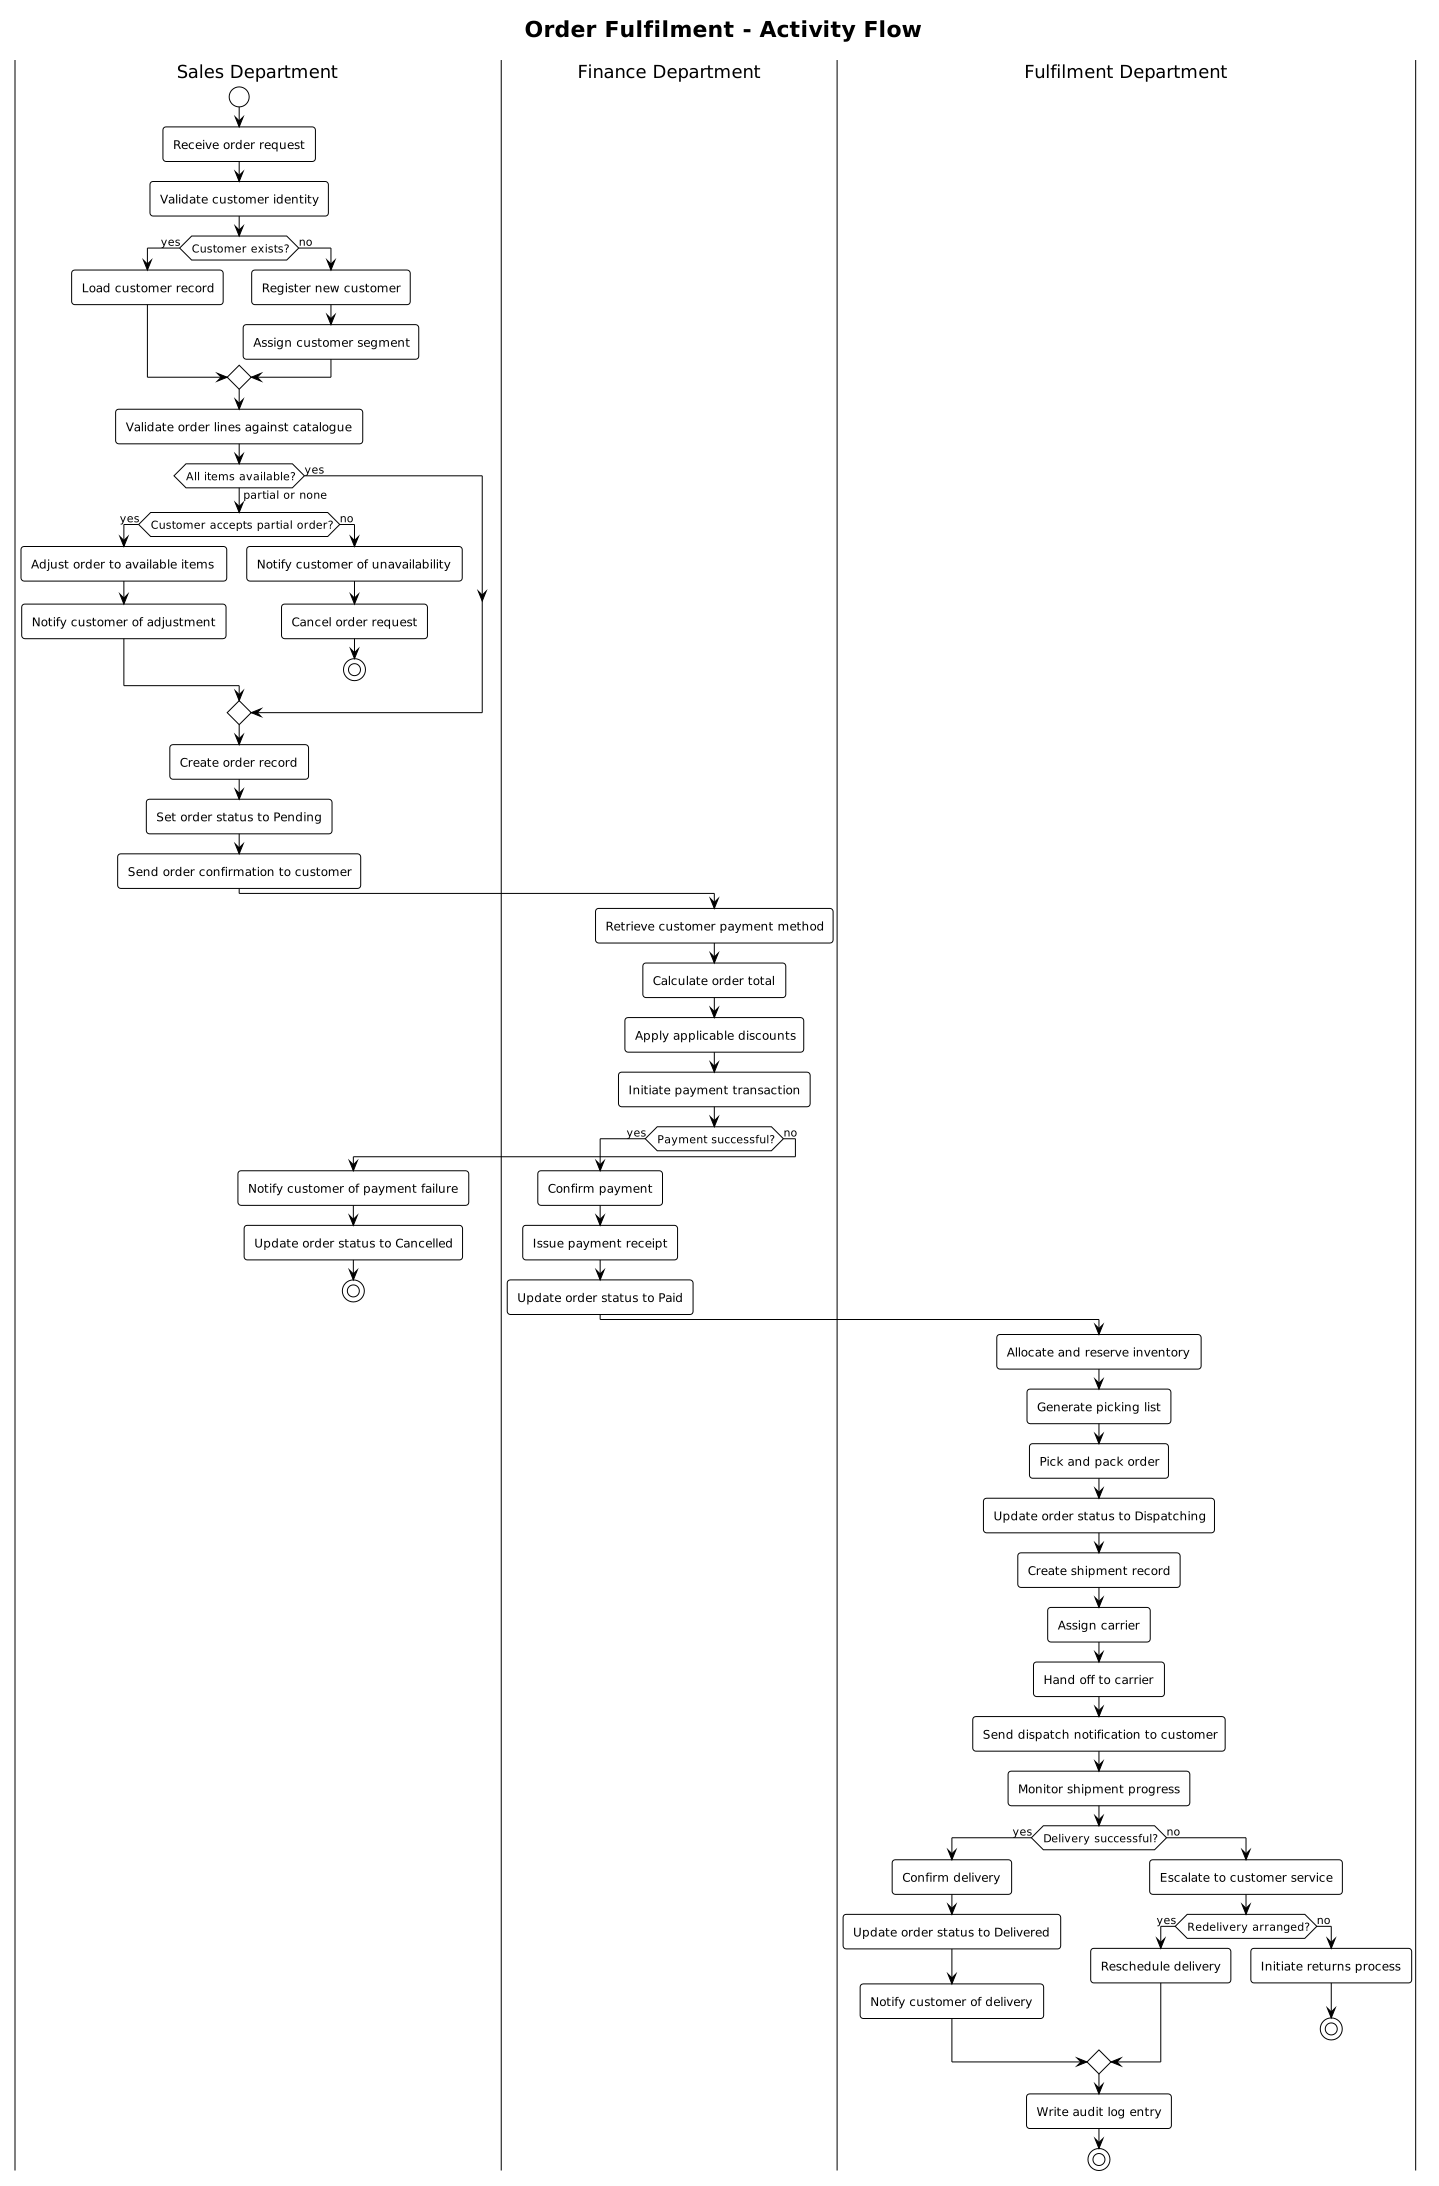
PlantUML source
@startuml activity-flow
!theme plain
skinparam roundcorner 6

title Order Fulfilment - Activity Flow

|Sales Department|
start
:Receive order request;
:Validate customer identity;
if (Customer exists?) then (yes)
  :Load customer record;
else (no)
  :Register new customer;
  :Assign customer segment;
endif

:Validate order lines against catalogue;
if (All items available?) then (yes)
else (partial or none)
  if (Customer accepts partial order?) then (yes)
    :Adjust order to available items;
    :Notify customer of adjustment;
  else (no)
    :Notify customer of unavailability;
    :Cancel order request;
    stop
  endif
endif

:Create order record;
:Set order status to Pending;
:Send order confirmation to customer;

|Finance Department|
:Retrieve customer payment method;
:Calculate order total;
:Apply applicable discounts;
:Initiate payment transaction;
if (Payment successful?) then (yes)
  :Confirm payment;
  :Issue payment receipt;
  :Update order status to Paid;
else (no)
  |Sales Department|
  :Notify customer of payment failure;
  :Update order status to Cancelled;
  stop
endif

|Fulfilment Department|
:Allocate and reserve inventory;
:Generate picking list;
:Pick and pack order;
:Update order status to Dispatching;
:Create shipment record;
:Assign carrier;
:Hand off to carrier;
:Send dispatch notification to customer;

:Monitor shipment progress;
if (Delivery successful?) then (yes)
  :Confirm delivery;
  :Update order status to Delivered;
  :Notify customer of delivery;
else (no)
  :Escalate to customer service;
  if (Redelivery arranged?) then (yes)
    :Reschedule delivery;
  else (no)
    :Initiate returns process;
    stop
  endif
endif

:Write audit log entry;
stop
@enduml
System View
The system view is the static architecture picture — what systems exist, who interacts with them, and how they are connected. It operates at four levels: a systems landscape shows all enterprise systems grouped by business capability, independent of any single solution; a systems map shows all solution systems grouped by role; a systems diagram shows all actors and systems as connected black boxes; a component diagram zooms into a single system to reveal its internal structure, interfaces, and data stores. Not every system needs a component diagram — produce one for systems you own that have meaningful internal structure. Where a component diagram reveals structure, a database schema captures the data model that component owns — scoped strictly to what it is responsible for.
Systems landscape (PlantUML — component diagram) — all systems across the enterprise, grouped by business capability; no solution boundary, no connections — the starting point for understanding what exists before deciding what to build or change
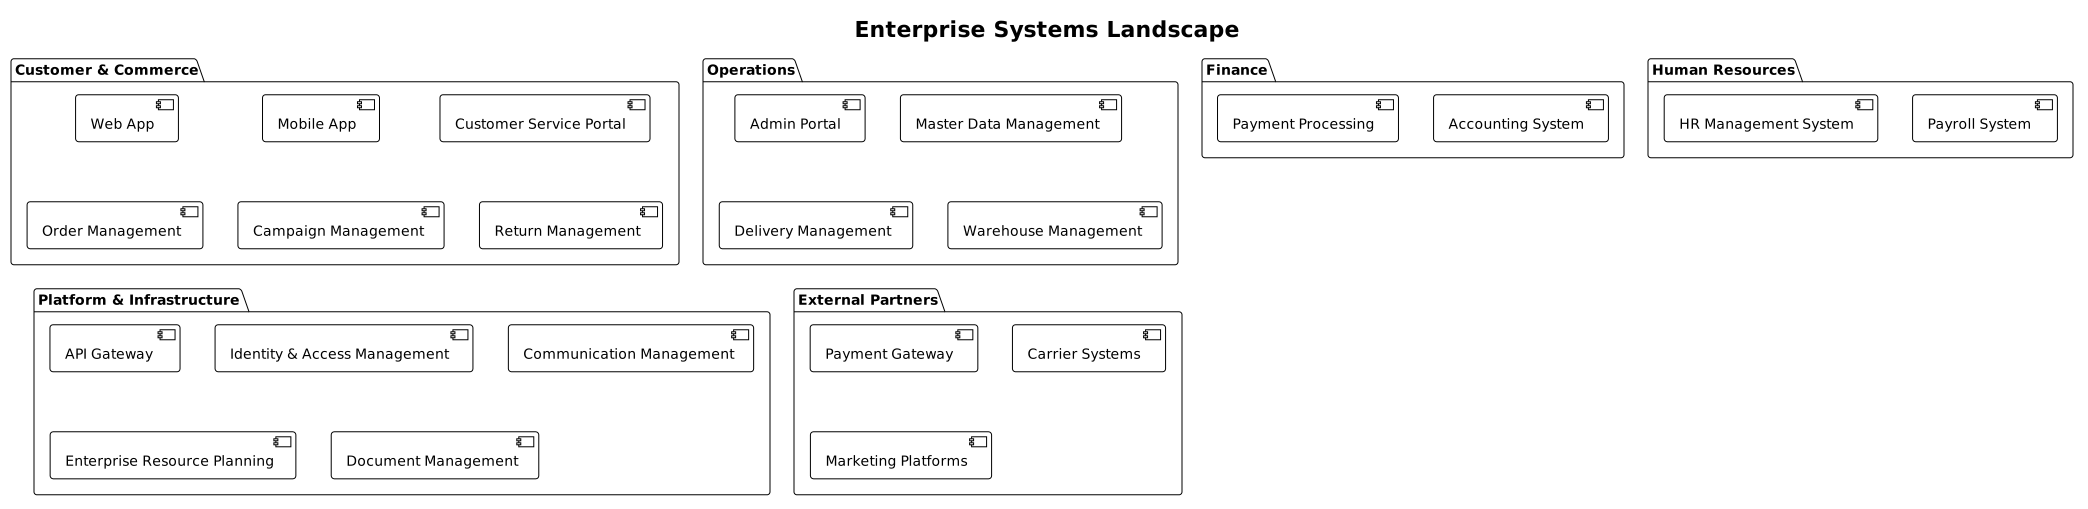
PlantUML source
@startuml systems-landscape
!theme plain
skinparam roundcorner 6

title Enterprise Systems Landscape

package "Customer & Commerce" {
  component "Web App"
  component "Mobile App"
  component "Customer Service Portal"
  component "Order Management"
  component "Campaign Management"
  component "Return Management"
}

package "Operations" {
  component "Admin Portal"
  component "Master Data Management"
  component "Delivery Management"
  component "Warehouse Management"
}

package "Finance" {
  component "Payment Processing"
  component "Accounting System"
}

package "Human Resources" {
  component "HR Management System"
  component "Payroll System"
}

package "Platform & Infrastructure" {
  component "API Gateway"
  component "Identity & Access Management"
  component "Communication Management"
  component "Enterprise Resource Planning"
  component "Document Management"
}

package "External Partners" {
  component "Payment Gateway"
  component "Carrier Systems"
  component "Marketing Platforms"
}
@enduml
Systems map (PlantUML — component diagram) — all systems within this solution grouped by role, without actors or connections; the orientation layer that shows the solution landscape at a glance before exploring how everything connects

PlantUML source
@startuml systems-map
!theme plain
skinparam roundcorner 6

title Systems Map

package "Customer Interaction" {
  component "Web App"
  component "Mobile App"
  component "API Gateway"
  component "Admin Portal"
  component "Customer Service Portal"
}

package "Business Enabling" {
  component "Order Management"
  component "Master Data Management"
  component "Campaign Management"
  component "Return Management"
  component "Delivery Management"
}

package "Finance" {
  component "Payment Processing"
  component "Accounting System"
}

package "Platform" {
  component "Identity & Access Management"
  component "Communication Management"
}
@enduml
Systems diagram (PlantUML — component diagram) — all actors and all systems as black boxes, with the connections between them; the entry point to the system view, readable by technical and non-technical audiences alike
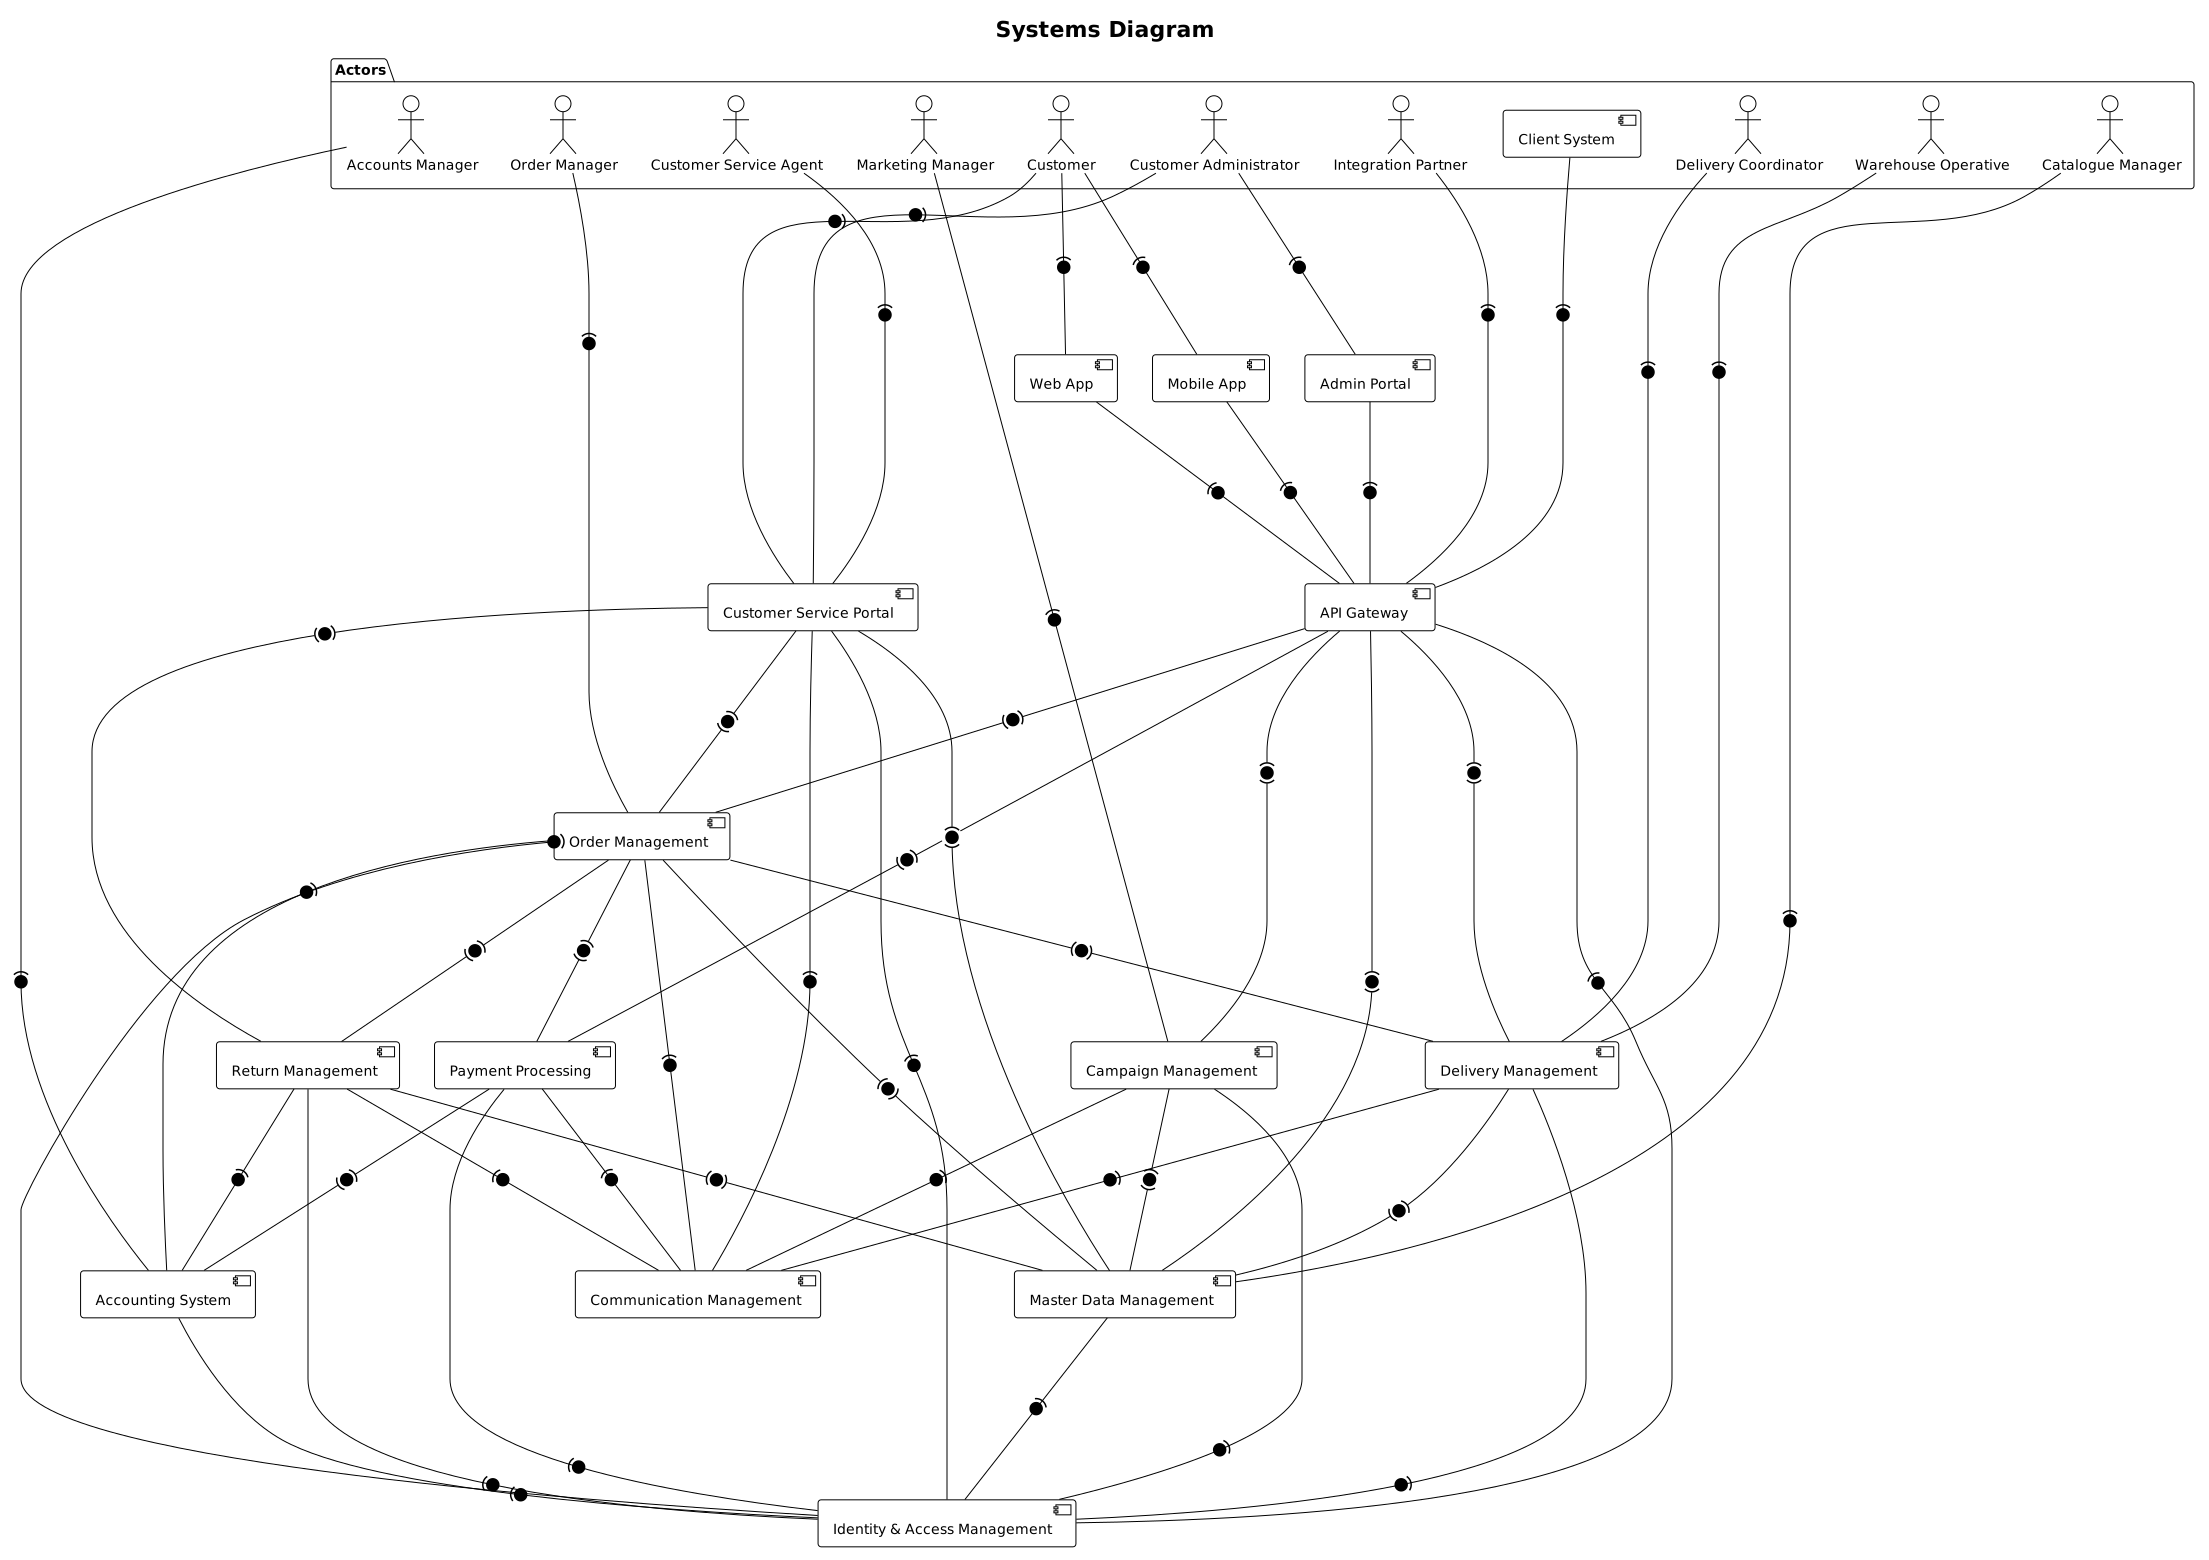
PlantUML source
@startuml system-diagram
!theme plain
skinparam roundcorner 6

title Systems Diagram

actor "Customer" as customer
actor "Partner" as partner
actor "Order Manager" as orderMgr
actor "Catalogue Manager" as catalogueMgr
actor "Customer Service Agent" as csAgent
actor "Accounts Manager" as accountsMgr
actor "Warehouse Operative" as warehouseOp

package "Customer Channels" {
  component "Web Application" as web
  component "Mobile App" as mobile
  component "Customer API" as customerApi
}

package "Internal Channels" {
  component "Admin Portal" as adminPortal
  component "Customer Service Console" as csConsole
  component "Partner API" as partnerApi
}

component "CTX-SL-CT: Catalogue" as catalogue
component "CTX-SL-OM: Order Management" as orderMgmt
component "CTX-FN-PM: Payment Management" as payments
component "CTX-FL-DS: Dispatch" as dispatch
component "CTX-CS-RT: Returns" as returns

customer --> web
customer --> mobile
customer --> customerApi
partner --> partnerApi
orderMgr --> adminPortal
catalogueMgr --> adminPortal
csAgent --> csConsole
accountsMgr --> adminPortal
warehouseOp --> adminPortal

web --> catalogue
web --> orderMgmt
mobile --> catalogue
customerApi --> orderMgmt
adminPortal --> catalogue
adminPortal --> orderMgmt
csConsole --> orderMgmt
partnerApi --> orderMgmt

orderMgmt --> payments
orderMgmt --> dispatch
orderMgmt --> returns
@enduml
Component diagram (PlantUML — component diagram) — the internal structure of a single system: its APIs, domain layer, data stores, and event queues, with the external systems it integrates with; produced once per system that you own and that has meaningful internal structure worth documenting
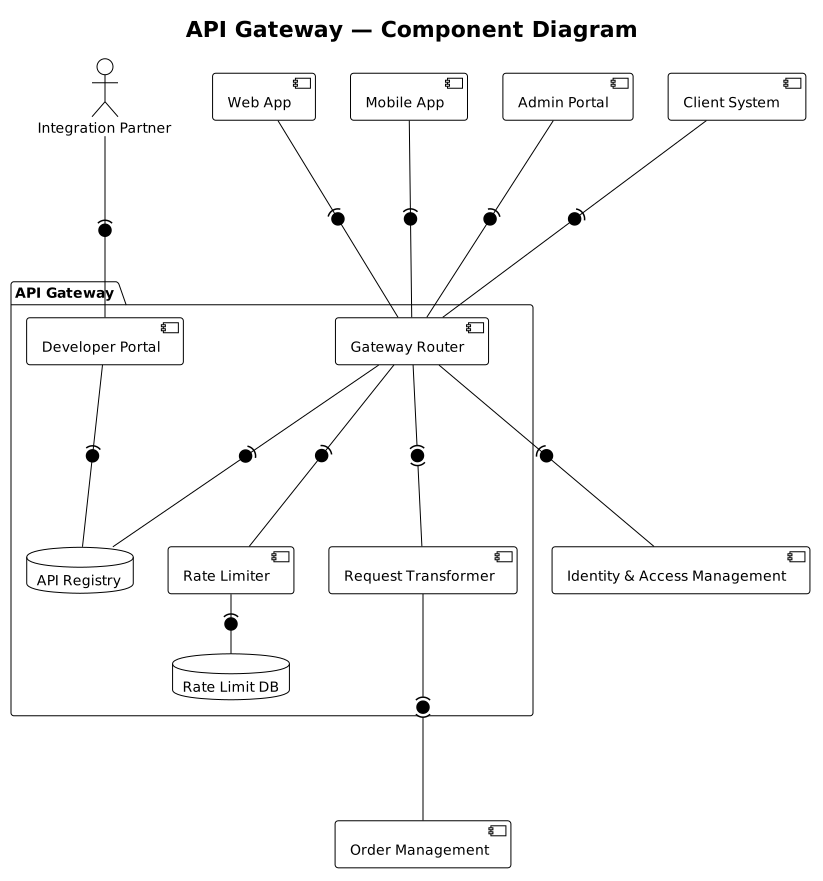
PlantUML source
@startuml component-diagram
!theme plain
skinparam roundcorner 6

title Order Management — Component Diagram

component "Web Application" as web
component "Mobile App" as mobile
component "Customer API" as customerApi
component "Admin Portal" as adminPortal
component "Customer Service Console" as csConsole
component "Partner API" as partnerApi

package "CTX-SL-OM: Order Management" {
  component "Order API" as orderApi
  component "Order Domain" as orderDomain
  database "Order DB" as orderDB
  queue "Event Bus" as bus
}

component "CTX-FN-PM: Payment Management" as payments
component "CTX-FL-DS: Dispatch" as dispatch
component "CTX-CS-RT: Returns" as returns

web --> orderApi
mobile --> orderApi
customerApi --> orderApi
adminPortal --> orderApi
csConsole --> orderApi
partnerApi --> orderApi

orderApi --> orderDomain
orderDomain --> orderDB
orderDomain --> bus
orderDomain --> payments
bus --> dispatch
bus --> returns
@enduml
Database schema (DBML) — the logical data model for a single component: tables, columns, data types, constraints, and relationships; scoped strictly to what that component owns. This example shows the Rate Limit DB inside the API Gateway — the persisted policy and audit layer behind a component often assumed to be purely in-memory
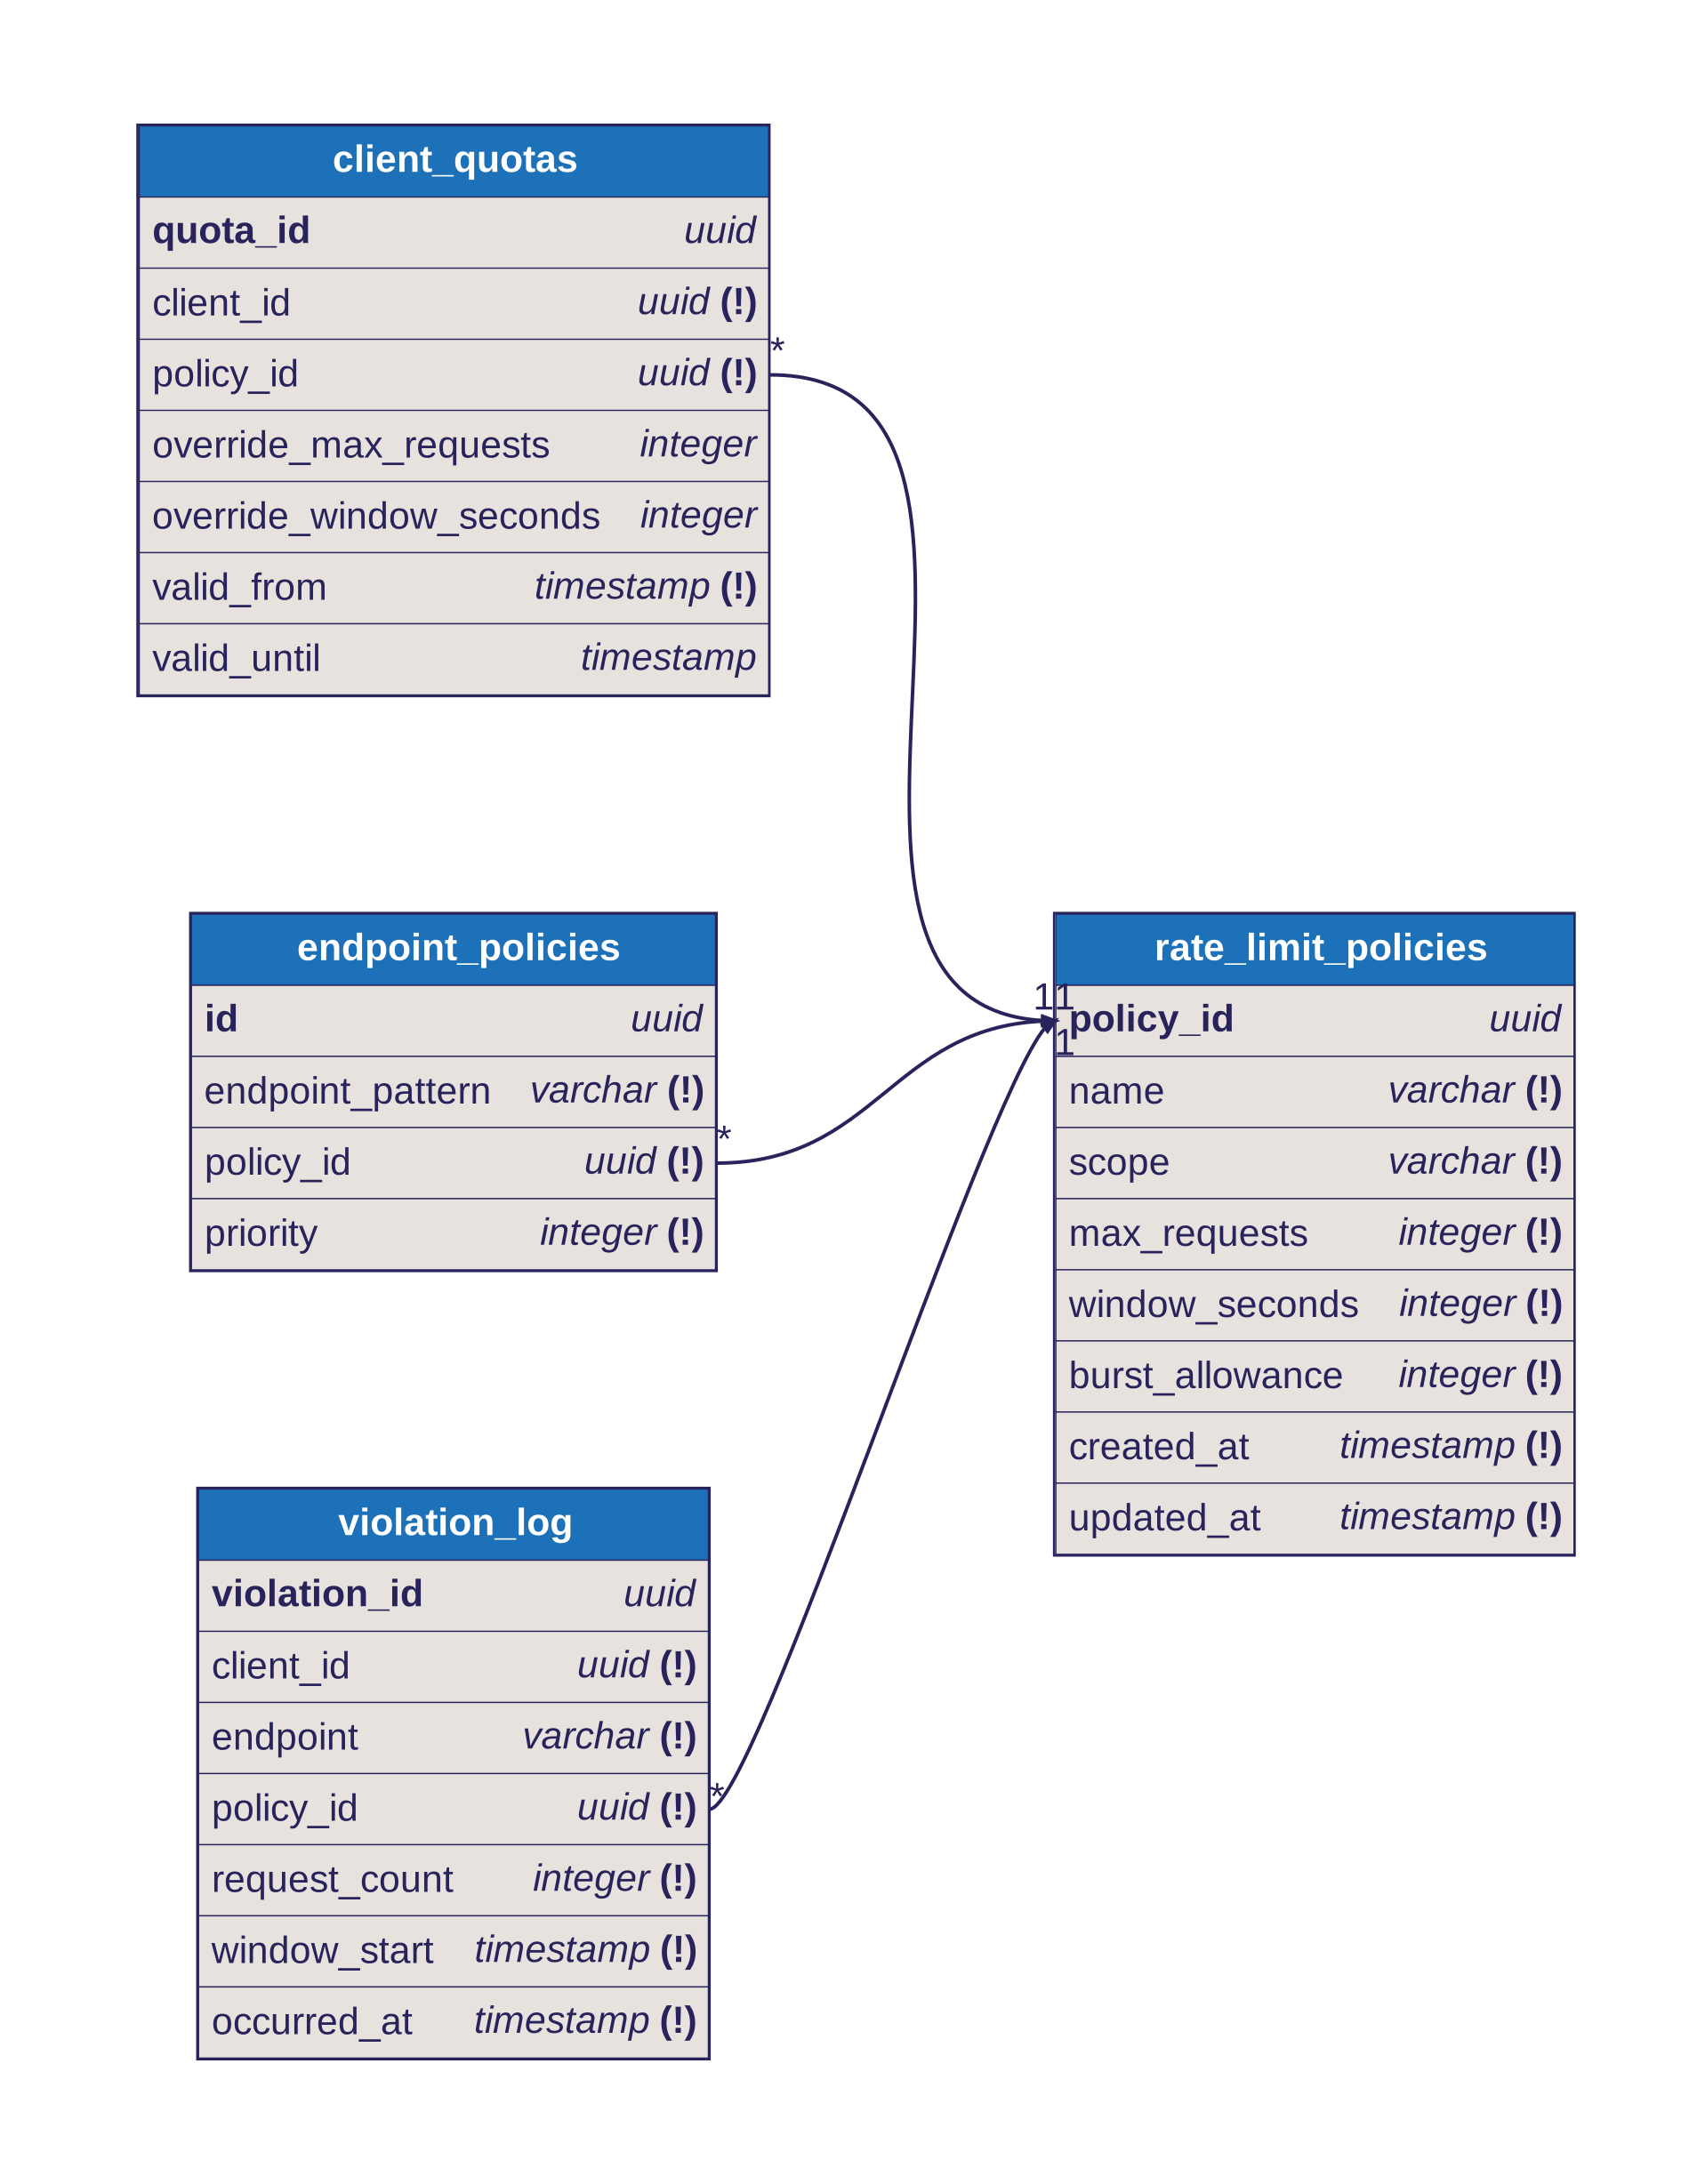
DBML source
Table rate_limit_policies {
  policy_id uuid [pk]
  name varchar [not null, unique]
  scope varchar [not null, note: 'global | per_client | per_endpoint']
  max_requests integer [not null]
  window_seconds integer [not null]
  burst_allowance integer [not null, default: 0]
  created_at timestamp [not null]
  updated_at timestamp [not null]
}

Table client_quotas {
  quota_id uuid [pk]
  client_id uuid [not null]
  policy_id uuid [not null, ref: > rate_limit_policies.policy_id]
  override_max_requests integer [note: 'null = use policy default']
  override_window_seconds integer [note: 'null = use policy default']
  valid_from timestamp [not null]
  valid_until timestamp
}

Table endpoint_policies {
  id uuid [pk]
  endpoint_pattern varchar [not null]
  policy_id uuid [not null, ref: > rate_limit_policies.policy_id]
  priority integer [not null, default: 0]
}

Table violation_log {
  violation_id uuid [pk]
  client_id uuid [not null]
  endpoint varchar [not null]
  policy_id uuid [not null, ref: > rate_limit_policies.policy_id]
  request_count integer [not null]
  window_start timestamp [not null]
  occurred_at timestamp [not null]
}
Interaction View
The interaction view is the dynamic companion to the system view — for a given scenario, how do the actors, systems, components, and interfaces interact over time, in what order, and with what data. This is the view where sequence diagrams are most at home.
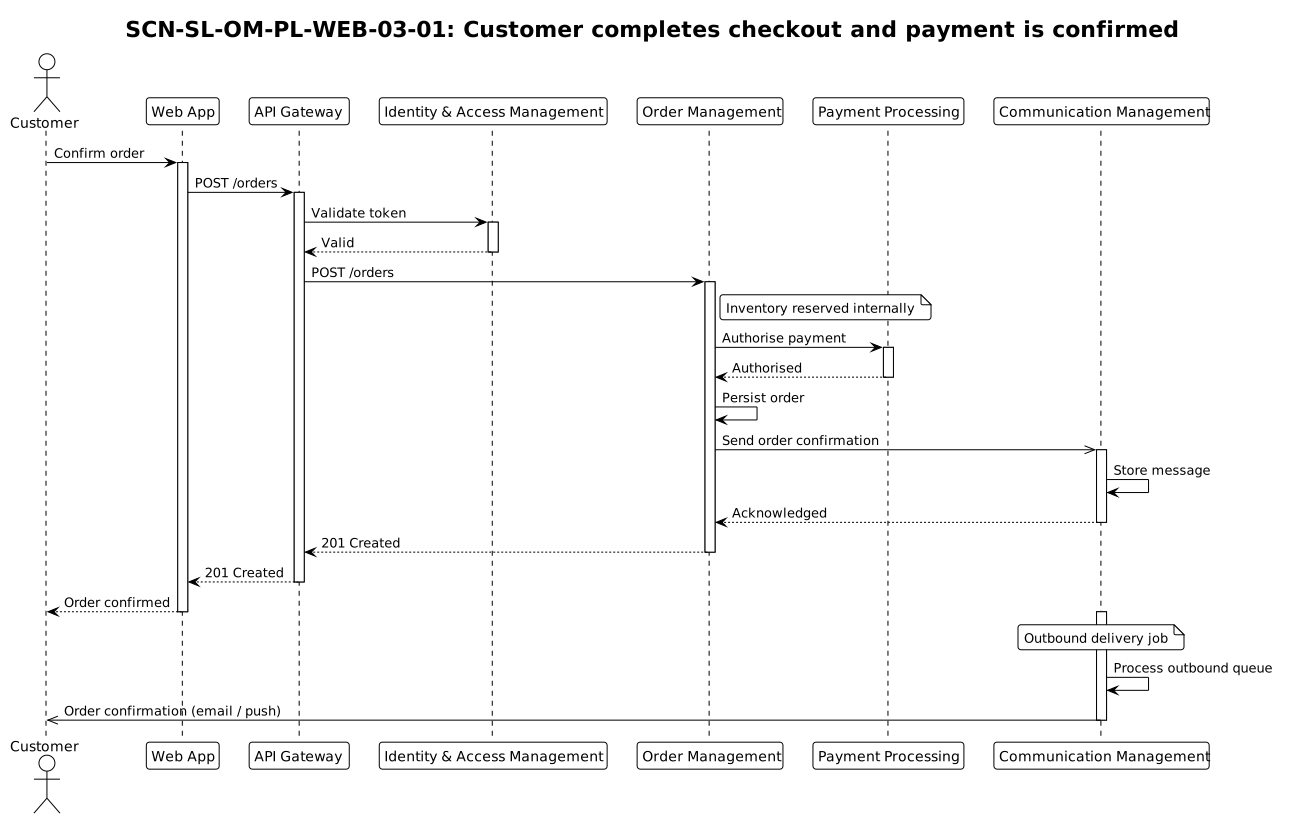
Each significant flow gets its own diagram — do not combine the happy path, the failure path, and the timeout into a single sequence. One scenario, one diagram. This post shows one example; a real project produces one diagram per scenario in the scenario map.
Sequence diagram (PlantUML — sequence diagram) — actors, systems, components, messages, and response data; one diagram per scenario, not one per feature. Happy path and each failure case are separate diagrams. This example covers SCN-SL-OM-PL-WEB-03-01: Customer completes checkout and payment is confirmed
PlantUML source
@startuml sequence-diagram
!theme plain
skinparam roundcorner 6

title SCN-SL-OM-PL-WEB-03-01: Customer completes checkout and payment is confirmed

actor "Customer" as customer
participant "Web App" as web
participant "API Gateway" as apiGateway
participant "Identity & Access Management" as iam
participant "Order Management" as orderMgmt
participant "Payment Processing" as payments
participant "Communication Management" as commsMgmt

customer -> web : Confirm order
activate web
web -> apiGateway : POST /orders
activate apiGateway
apiGateway -> iam : Validate token
activate iam
iam --> apiGateway : Valid
deactivate iam
apiGateway -> orderMgmt : POST /orders
activate orderMgmt
note right of orderMgmt : Inventory reserved internally
orderMgmt -> payments : Authorise payment
activate payments
payments --> orderMgmt : Authorised
deactivate payments
orderMgmt -> orderMgmt : Persist order
orderMgmt ->> commsMgmt : Send order confirmation
activate commsMgmt
commsMgmt -> commsMgmt : Store message
commsMgmt --> orderMgmt : Acknowledged
deactivate commsMgmt
orderMgmt --> apiGateway : 201 Created
deactivate orderMgmt
apiGateway --> web : 201 Created
deactivate apiGateway
web --> customer : Order confirmed
deactivate web

note over commsMgmt : Outbound delivery job
activate commsMgmt
commsMgmt -> commsMgmt : Process outbound queue
commsMgmt ->> customer : Order confirmation (email / push)
deactivate commsMgmt
@enduml
Operational View
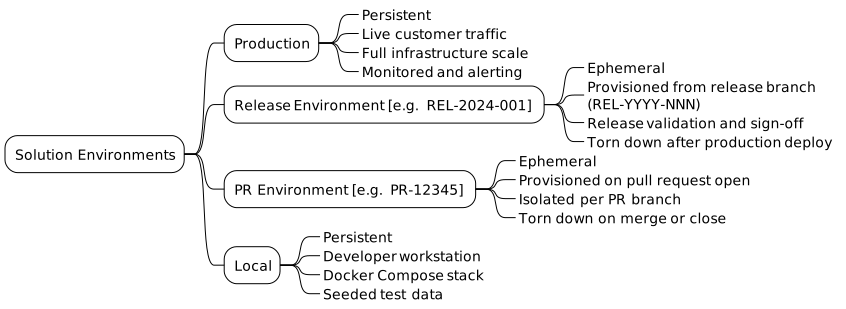
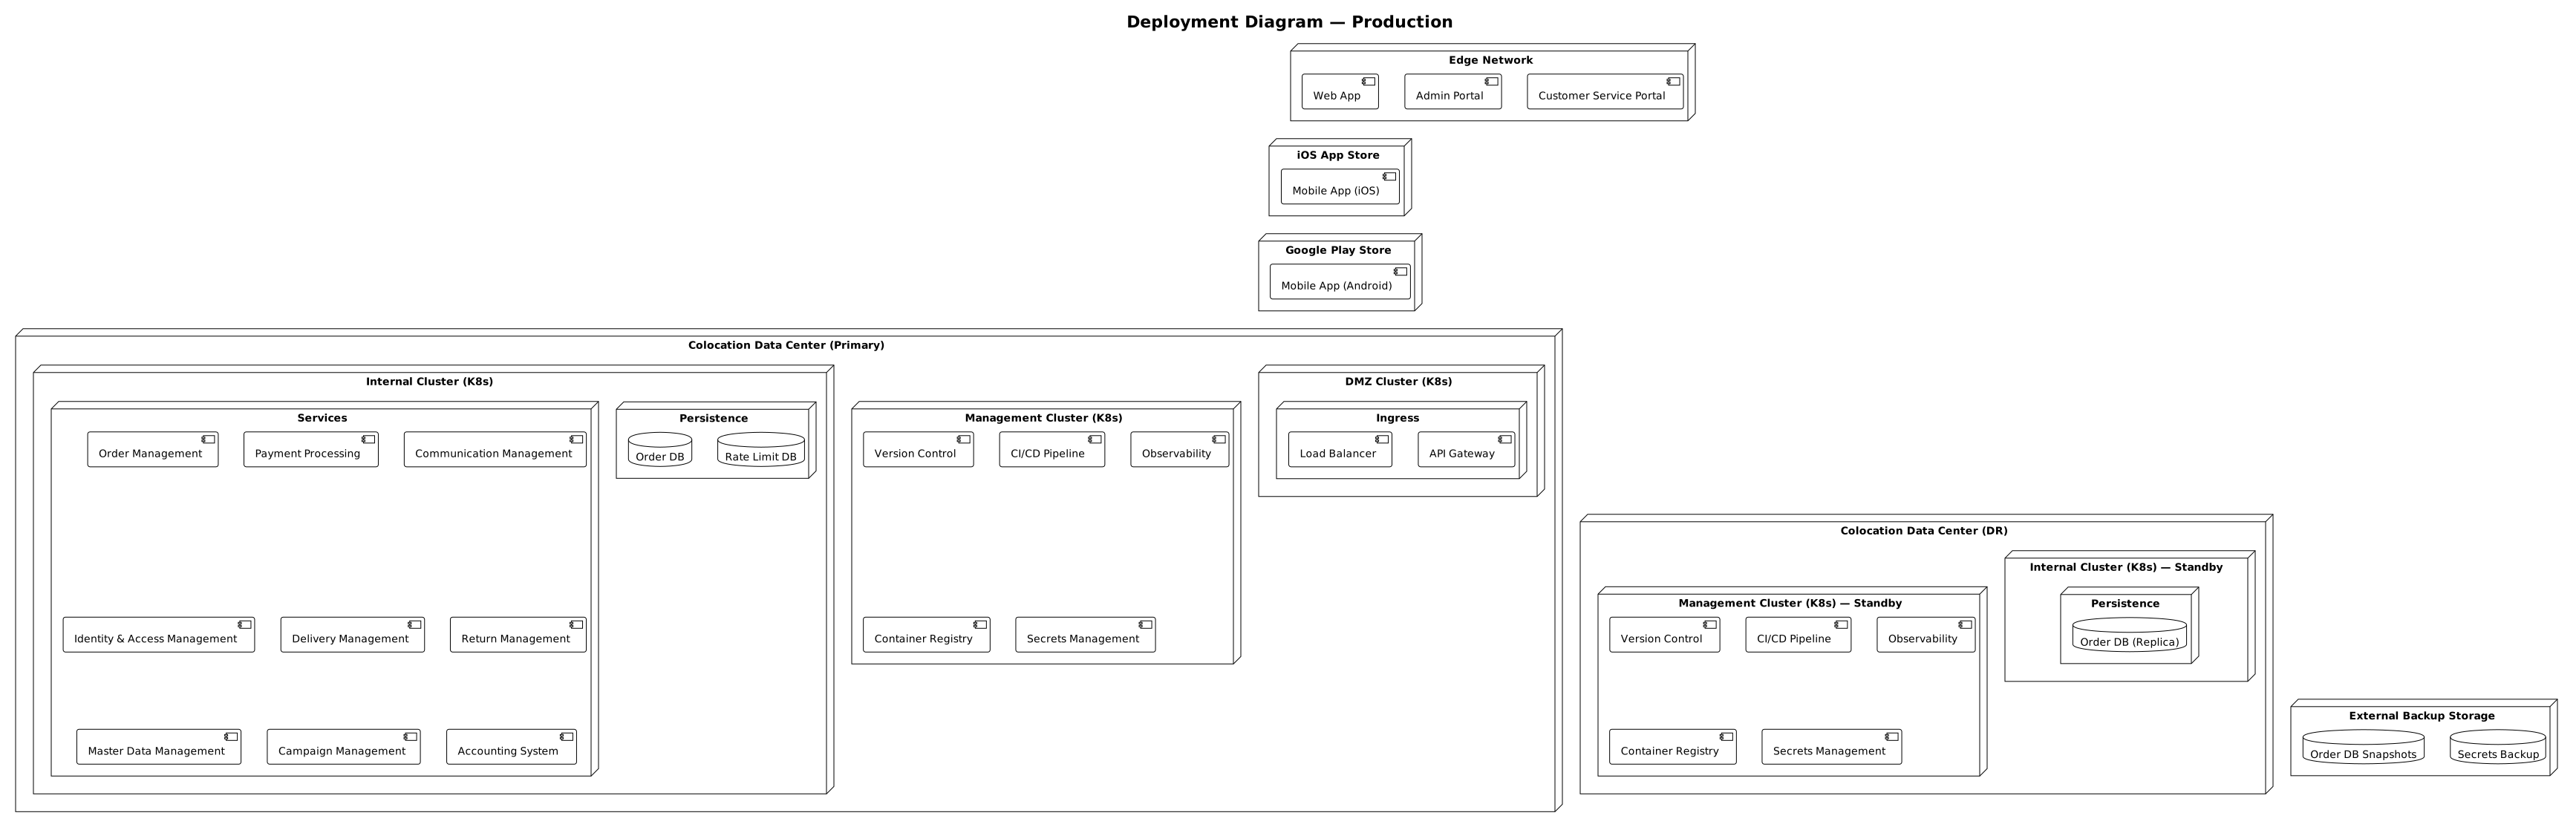
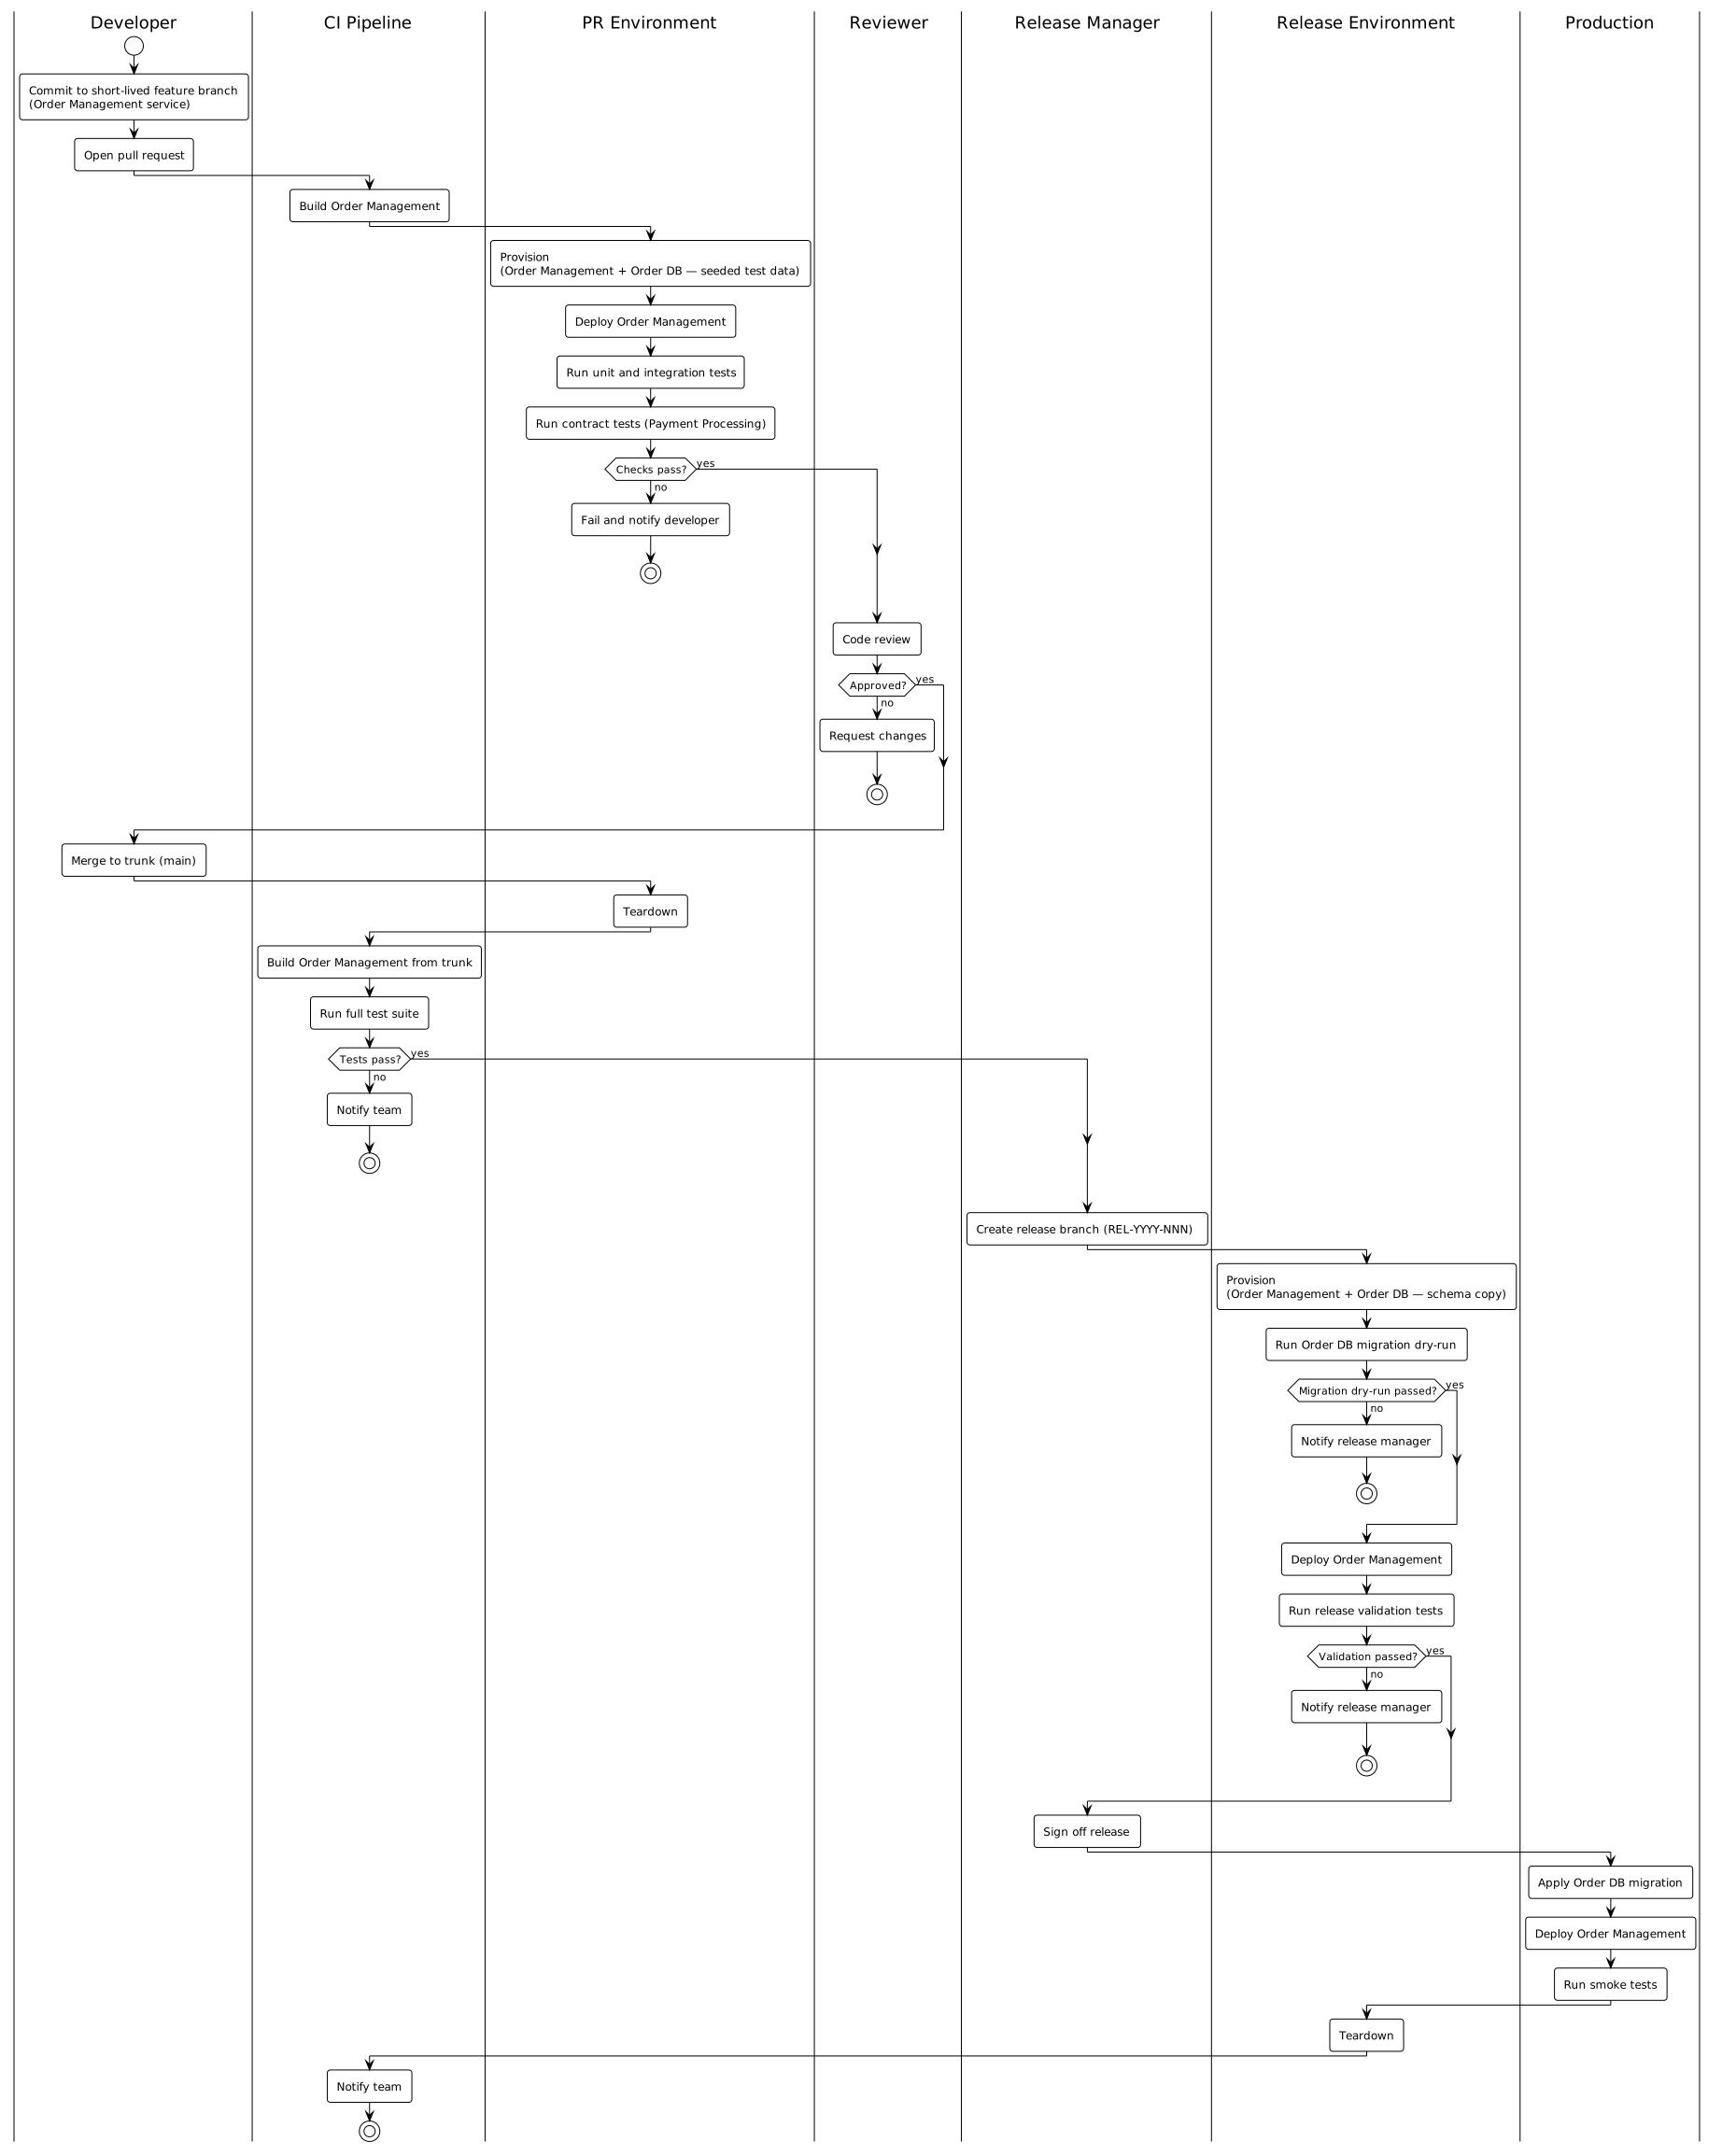
The operational view captures where the solution runs and how changes get there. Three diagrams cover it: an environment map inventories all environments and their lifecycle — making the distinction between persistent and ephemeral environments explicit; a deployment diagram shows the layered topology of a specific environment; and a deployment pipeline shows the stages a change moves through from commit to production.
Environment map (PlantUML — mind map) — all environments in the solution grouped by lifecycle: persistent environments exist continuously; ephemeral environments are provisioned on demand and torn down after use; making this distinction explicit prevents the common mistake of treating PR and release environments as permanent infrastructure
PlantUML source
@startmindmap environment-map
!theme plain
* Solution Environments
** Production
***_ Persistent
***_ Live customer traffic
***_ Full infrastructure scale
***_ Monitored and alerting
** Release Environment [e.g. REL-2024-001]
***_ Ephemeral
***_ Provisioned from release branch (REL-YYYY-NNN)
***_ Release validation and sign-off
***_ Torn down after production deploy
** PR Environment [e.g. PR-12345]
***_ Ephemeral
***_ Provisioned on pull request open
***_ Isolated per PR branch
***_ Torn down on merge or close
** Local
***_ Persistent
***_ Developer workstation
***_ Docker Compose stack
***_ Seeded test data
@endmindmap
Deployment diagram (PlantUML — deployment diagram) — the layered topology of a single environment, from edge network and CDN down through Kubernetes clusters to disaster recovery and off-site backup; shows where each part of the solution runs and how the layers relate
PlantUML source
@startuml deployment-diagram
!theme plain
skinparam roundcorner 6
title Deployment Diagram — Production

node "Edge Network" {
  component "Web App" as web
  component "Admin Portal" as adminPortal
  component "Customer Service Portal" as csPortal
}

node "iOS App Store" {
  component "Mobile App (iOS)" as mobileIOS
}

node "Google Play Store" {
  component "Mobile App (Android)" as mobileAndroid
}

node "Colocation Data Center (Primary)" {
  node "DMZ Cluster (K8s)" {
    node "Ingress" {
      component "Load Balancer" as lb
      component "API Gateway" as gw
    }
  }

  node "Internal Cluster (K8s)" {
    node "Services" {
      component "Order Management" as orderMgmt
      component "Payment Processing" as payments
      component "Communication Management" as commsMgmt
      component "Identity & Access Management" as iam
      component "Delivery Management" as deliveryMgmt
      component "Return Management" as returnMgmt
      component "Master Data Management" as mdm
      component "Campaign Management" as campaignMgmt
      component "Accounting System" as accounting
    }
    node "Persistence" {
      database "Order DB" as orderDB
      database "Rate Limit DB" as rateLimitDB
    }
  }

  node "Management Cluster (K8s)" {
    component "Version Control" as vcs
    component "CI/CD Pipeline" as cicd
    component "Observability" as observability
    component "Container Registry" as registry
    component "Secrets Management" as secrets
  }
}

node "Colocation Data Center (DR)" {
  node "Internal Cluster (K8s) — Standby" {
    node "Persistence " {
      database "Order DB (Replica)" as orderDBDR
    }
  }

  node "Management Cluster (K8s) — Standby" {
    component "Version Control" as vcsDR
    component "CI/CD Pipeline" as cicdDR
    component "Observability" as observabilityDR
    component "Container Registry" as registryDR
    component "Secrets Management" as secretsDR
  }
}

node "External Backup Storage" {
  database "Order DB Snapshots" as backupOrderDB
  database "Secrets Backup" as backupSecrets
}

web -[hidden]-> mobileIOS
mobileIOS -[hidden]-> mobileAndroid
mobileAndroid -[hidden]-> lb
lb -[hidden]-> orderDBDR
orderDBDR -[hidden]-> backupOrderDB
@enduml
Deployment pipeline (PlantUML — activity diagram) — the stages an Order Management service change moves through from local to production, based on trunk-based development: short-lived feature branches with isolated PR environments, contract tests against Payment Processing on every PR, merge to trunk, release branch creation (REL-YYYY-NNN), a database migration dry-run gate before release validation, sign-off, schema migration then deployment to production; ephemeral environments are provisioned and torn down as part of the pipeline, not managed separately
PlantUML source
@startuml deployment-pipeline
!theme plain
skinparam roundcorner 6

|Developer|
start
:Commit to short-lived feature branch
(Order Management service);
:Open pull request;

|CI Pipeline|
:Build Order Management;

|PR Environment|
:Provision
(Order Management + Order DB — seeded test data);
:Deploy Order Management;
:Run unit and integration tests;
:Run contract tests (Payment Processing);

if (Checks pass?) then (yes)
else (no)
  :Fail and notify developer;
  stop
endif

|Reviewer|
:Code review;

if (Approved?) then (yes)
else (no)
  :Request changes;
  stop
endif

|Developer|
:Merge to trunk (main);

|PR Environment|
:Teardown;

|CI Pipeline|
:Build Order Management from trunk;
:Run full test suite;

if (Tests pass?) then (yes)
else (no)
  :Notify team;
  stop
endif

|Release Manager|
:Create release branch (REL-YYYY-NNN);

|Release Environment|
:Provision
(Order Management + Order DB — schema copy);
:Run Order DB migration dry-run;

if (Migration dry-run passed?) then (yes)
else (no)
  :Notify release manager;
  stop
endif

:Deploy Order Management;
:Run release validation tests;

if (Validation passed?) then (yes)
else (no)
  :Notify release manager;
  stop
endif

|Release Manager|
:Sign off release;

|Production|
:Apply Order DB migration;
:Deploy Order Management;
:Run smoke tests;

|Release Environment|
:Teardown;

|CI Pipeline|
:Notify team;
stop
@enduml
Where This Leaves You
The matrix below maps each diagram artifact to the tool and diagram type used to produce it. Columns are grouped by tool; rows are grouped by view.
| View | Diagram | PlantUML | Mermaid | BPMN.io | DBML | |||||||
|---|---|---|---|---|---|---|---|---|---|---|---|---|
| Mind Map | Class | Component | Sequence | Activity | WBS | Deployment | Journey | Quadrant Chart | BPMN | Schema | ||
| Current State | Any diagram type — determined by which pain points need to be visible | |||||||||||
| Domain | Domain map | ✓ | ||||||||||
| Domain model | ✓ | |||||||||||
| Requirements | Stakeholder map | ✓ | ||||||||||
| Stakeholder stories map | ✓ | |||||||||||
| Feature map | ✓ | |||||||||||
| Scenario map | ✓ | |||||||||||
| Feature priority quadrant | ✓ | |||||||||||
| Customer | Segment map | ✓ | ||||||||||
| Segment quadrant | ✓ | |||||||||||
| Channel diagram | ✓ | |||||||||||
| Journey diagram | ✓ | |||||||||||
| Organizational | Org chart | ✓ | ||||||||||
| Actor to organisation map | ✓ | |||||||||||
| Information | Information model | ✓ | ||||||||||
| Process | Process model | ✓ | ||||||||||
| Activity flow | ✓ | |||||||||||
| System | Systems landscape | ✓ | ||||||||||
| Systems map | ✓ | |||||||||||
| Systems diagram | ✓ | |||||||||||
| Component diagram | ✓ | |||||||||||
| Database schema | ✓ | |||||||||||
| Interaction | Sequence diagram | ✓ | ||||||||||
| Operational | Environment map | ✓ | ||||||||||
| Deployment diagram | ✓ | |||||||||||
| Deployment pipeline | ✓ | |||||||||||
The matrix maps every diagram in this post to the view it belongs to and the tool that produces it. Read it as a checklist: if a view has no check marks for your solution, that documentation gap is deliberate or it is an oversight — the matrix makes it visible either way.
The choices here are one path through the space. Different teams will reach for different tools and different diagram types for the same views. What does not change is the mapping itself: each view has a natural diagram type, and knowing which type serves which view is the starting point for any documentation practice worth maintaining.
Which views do you document, and which do you skip? Which diagram types have you found most useful — and where have you hit the limits of what a diagram can express? Get in touch — I’m always interested in comparing notes on how different teams approach this.
I will be writing more on how this fits into an Everything as Code practice — version control, pipelines, and documentation all treated as first-class engineering concerns.
Follow my RSS feed to catch it when it lands.